Last updated at Mon, 30 Oct 2017 14:23:02 GMT
With mobile technology becoming a bigger part of many companies’ front end coverage, it makes sense to ensure that you are getting a good return on your investment by delivering a high quality app that works for your users.
With this in mind we are excited to announce the release of our iOS and Android libraries. When used in conjunction with our JavaScript library, these will give you coverage over virtually your whole front end.
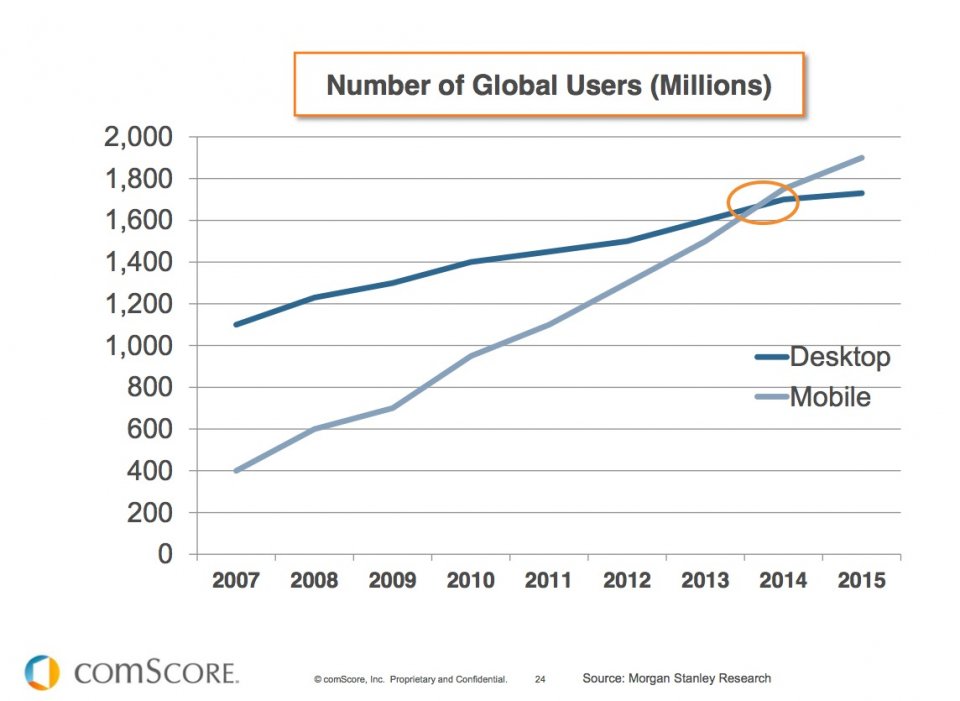
Mobile adoption for UI based tasks has been on the increase since smart phones first emerged and, according to Morgan Stanley Research, it is believed that there will be a tipping point this year where users use their mobile devices for web based activity as much as their desktops.
 With this in mind there are a couple of vital factors to think about when looking at how your front end / user facing clients are behaving.
- Is it functioning correctly?
- Are all the devices and OS permutations supported?
- What is the experience like to the user?
- What functionality are your users using and how often?
Before now you may have had to use specialized products to help you get some insight into any of these items. Even if you did find some anomalies it would have been hard to identify the issues without the context of your back-end logs to help identify the cause of the issues.
By using our mobile libraries, you can now log directly from your front end device to Logentries. This gives you an incredibly powerful tool, with all of your logs from throughout the stack in one place.
By pushing all of your logs and stack traces from all of your clients, as well as from any back end systems you may have, into Logentries you gain a single tool giving an unprecedented view into your complete stack. This allows you to go well beyond basic reactive issue management. You can now be proactive and help to ensure that you are delivering the best product you can to your users.
A very simple example of some uses for our libraries
You are a developer, developing a new iOS app and want to ensure that:
- You catch any crash reports
- All the device/OS configurations are being supported
- The app is performing as expected
- The app is providing a good user experience
- You capture what functions users are using (so as ensure development focus on what’s important)
By using our new libraries this simple, yet diverse, set of requirements can be accomplished. Here’s how:
Step 1: Set up the library within the app
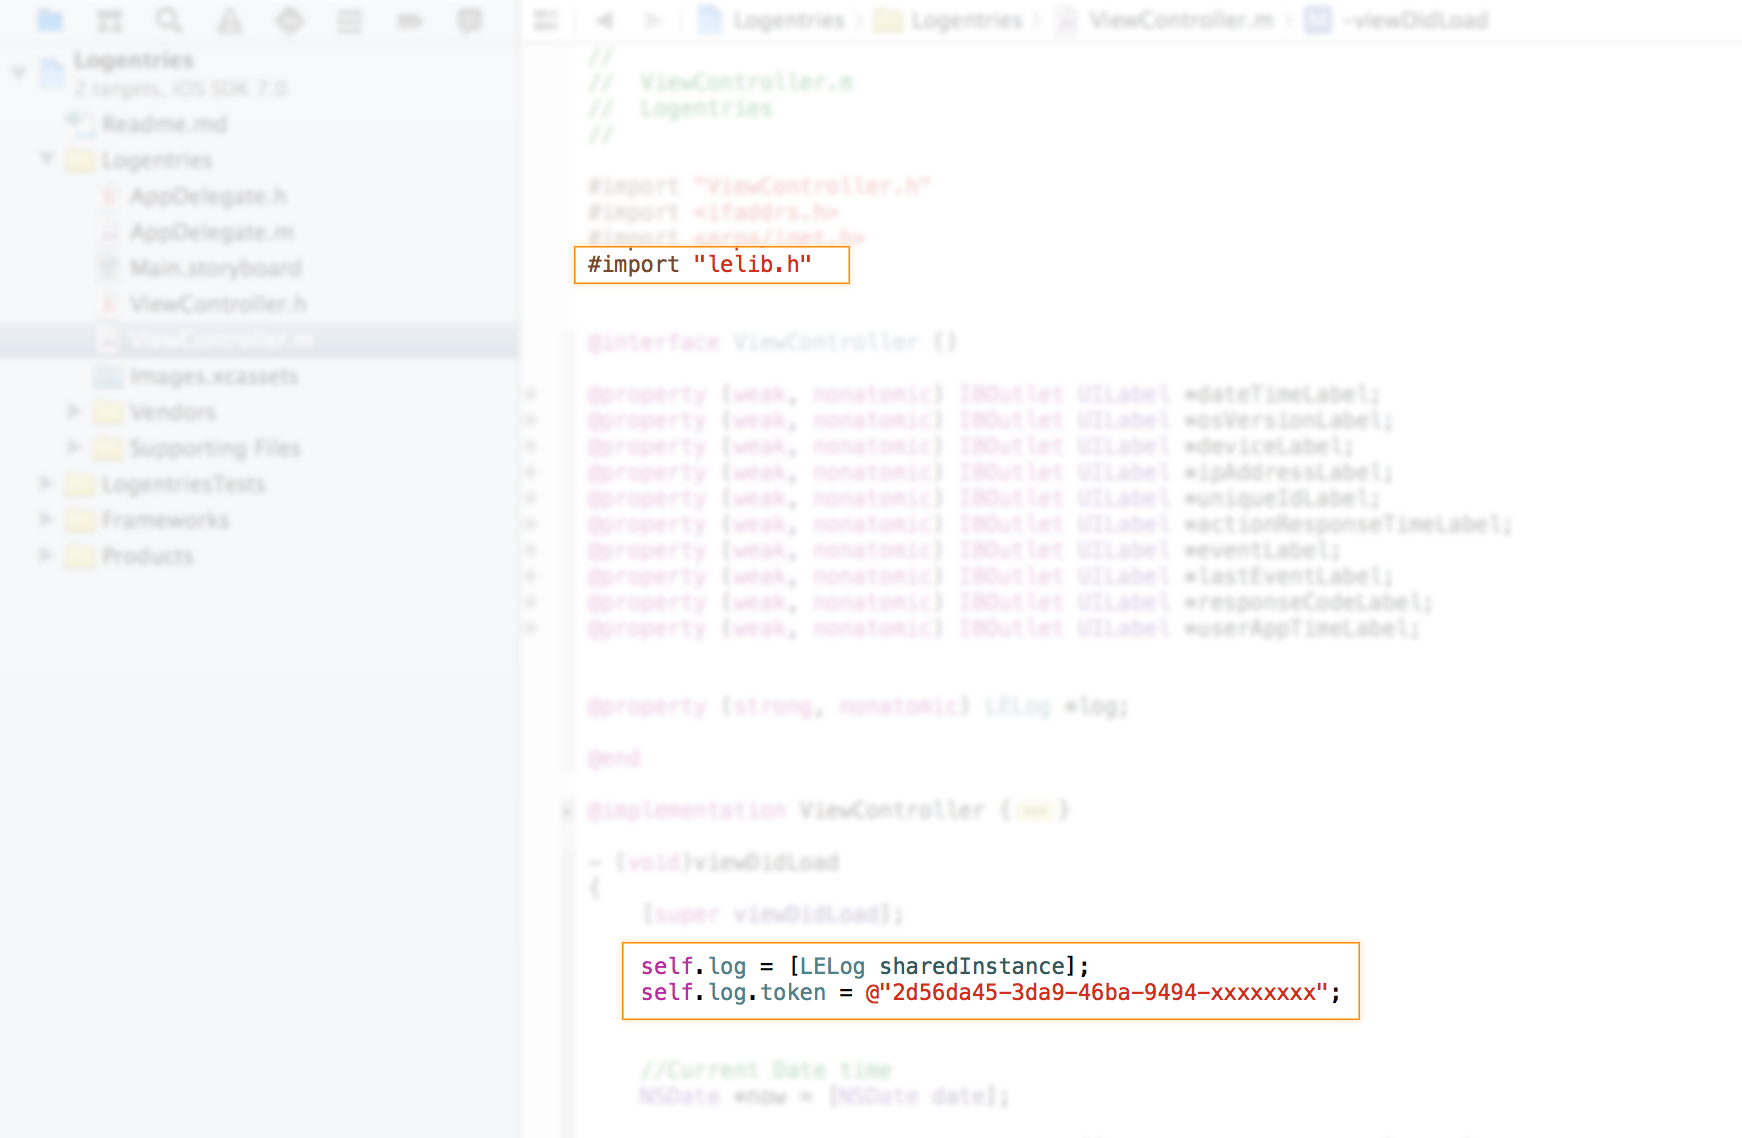
Setting up our library within your app is as simple as adding 3 lines of code.
- Import the library
- Declare an instance
- Set your token to identify the logs within Logentries
Now we are ready to start to send log events to Logentries.
Step 2: Set up our library to catch stack traces if your application fails
It’s built into our iOS library so nothing to do here…Done! 🙂
Step 3: Make sure that your application is functioning on all your clients’ devices
Developers do not have access to every permutation of each OS and device, so testing on all of these can be prohibitive. Also, it’s impossible to test on unreleased OS’s and devices. By using our logging library you are able to catch any crashes due to new or existing device and OS configurations.
To do this you simply catch all the relevant device info on application load and send this off as the very first action. This way, if the app crashes during the initial setup, you’ve captured this data and can identify the offending device and OS configuration.
thisOSVersion = [[UIDevice currentDevice] systemVersion];
thisdevice = [[UIDevice currentDevice] model];
ipAddress = [self getIPAddress];
userID = [[MyCode userName] userIdentifierIfAvailable];

NSString *logmessage = [NSString stringWithFormat:@" os=%@ device=%@ ipAddress=%@ uniqueID=%@", thisOSVersion, thisdevice, ipAddress, uniqueId];
[self.log log:logmessage];
Sample iOS code
Step 4: Make sure that the App is performing as expected – Mobile logging best practices
This comes down to general good practices for application logging. You should try to log any time a key action is fired within the app (be it user driven or machine driven) and log the outcome of the event. This way you can track the app’s own activity and how it is behaving.
If the outcome of the event is not as expected you should also fire a specific log entry into Logentries to identify the offending event. You should include a simple keyword to help you quickly identify that a non-expected event that has been found and you should try to include as much detail as possible.
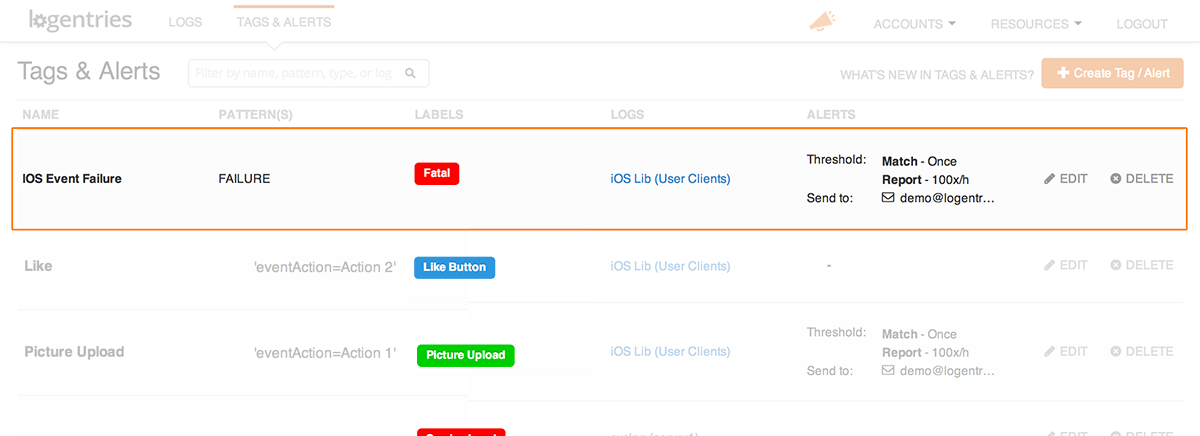
By using this keyword as an identifier you can then easily set up an alert within Logentries to notify you when said event happens so you can react extremely quickly to unexpected events. For example:
NSString *alertLevel = @"FAILURE";

NSString *logmessage = [NSString stringWithFormat:@" os=%@ device=%@ ipAddress=%@ uniqueID=%@ alertLevel=%@ eventID=%@", thisOSVersion, thisdevice, ipAddress, uniqueId, alertLevel, eventId];

[self.log log:logmessage];
Sample iOS code
Now that you are capturing any failures in your app as well as logs from your back end systems, you can use our log management tool to go the whole way through your stack and identify the cause of failures you may be finding. No longer do you have to switch between tools and log sources in attempts to find this needle in a haystack.
Step 5: The App is providing a good user experience
Nothing will kill an app quicker than a poor user experience. If users find that the app is unresponsive every time, then they will quickly become disillusioned and stop using your app.
Avoid this by tracking how responsive the app is to the user. Track the time it takes between a user request within the app to when the app has delivered the appropriate response. You can then send this data in the form of a log entry to Logentries and hence keep a track of your users experience. Combine this with other key metrics to establish the reasons for poor experience, such as old devices, geographical location, slow back-end responses, etc.
A sample log entry that you could send may look something like:
18:05:44.799 dataTime=18:02 os=7.0.3 device=iphone3 ipAddress=172.24.76.122 uniqueID=bf25012786 actionResponseTime=1005ms eventAction=likeButton lastEvent=openImage responseCode=202 userAppTime=127s
Sample Log entry
You can then set an alert within log entries to monitor the actionResponseTime so that, if the response time is greater than a certain value, it will be marked in the logs and you can receive an alert if it happens a certain number of times within a certain time period. So you could create an alert if “actionResponseTime>500” using this simple pattern.
Step 6: What are users doing within your app
No longer are logs just for bug tracking and reactive issue management. Take your logging to the next level and track users behavior within your app. Log actions that your user performs within the app and see the events on Logentries in real-time.
Track items such as:
- An individuals session behavios (use a unique identifier per user)
- Most commonly used actions within your app
- How long a user lives within your app
- How user activity trends over time
- Current active users
- Most common user submitted data
- And more…
Then use our tagging feature to instantly create counts as well as our sum and average search functions to gain some real insight into your users’ behaviors. The limits are really only in your imagination.
With this insight into what your users are doing within your application, you are armed with some incredibly powerful information that can help you ensure that you focus on the key areas that are important to your business and your users ensuring that you leverage all opportunities to make your product a success.


