Last updated at Tue, 31 Oct 2017 19:06:10 GMT
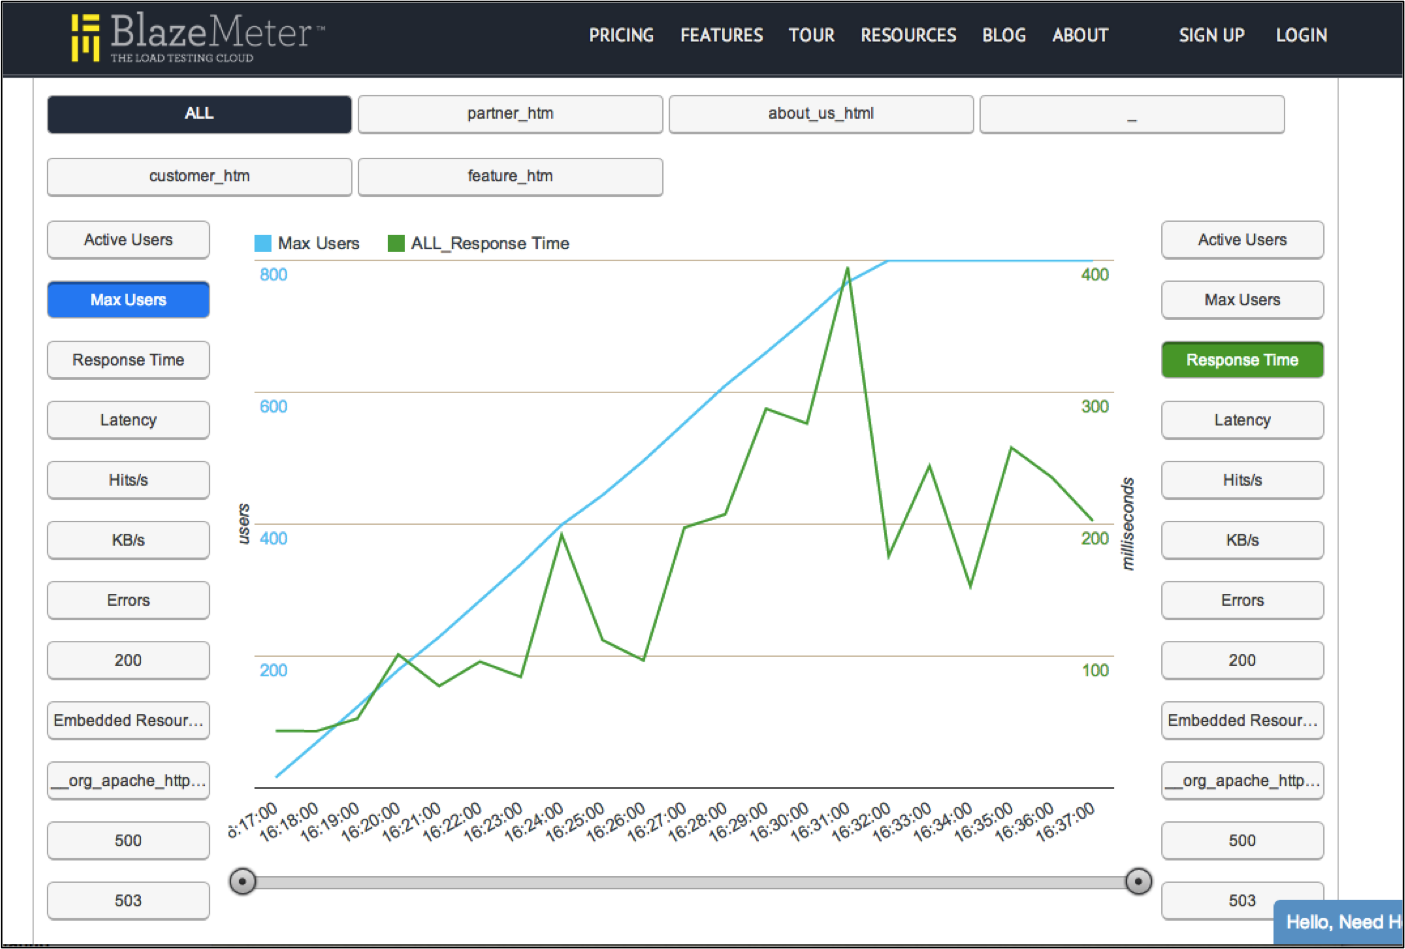
We recently hosted a webinar about running load tests (with BlazeMeter) and then analyzing the log data generated on the application under test (with Logentries). We had a great response and I wanted to share a few more thoughts about why load and stress testing your applications is an important step in understanding how your systems will behave in production when increased load hits. Load tests can help you understand if you have sufficient capacity in place and if increasing system load will introduce system errors. BlazeMeter does a great job in capturing the overall request response time as well as any http error codes and can show you at what point these begin to kick in as your user volume increases.
So why would you also need to analyze your application log data?
-
Understanding Errors: Often your system will run perfectly when not under stress, but may start to run into problems when load significantly increases. Load testing tools can tell you that something is awry and that the user did not receive a response, for example. However, to understand the root cause of the issue you will generally need to look at your application logs to figure out if an exception was thrown somewhere along the request as it propagates through your system. This can give you an indication as to whether the issue was a software bug, or simply an issue with insufficient resource capacity as your volume increases. Furthermore, underlying system issues could be occurring and may not be captured by the load test tool. For example, your system may be throwing exceptions and recovering from these or there may be symptoms of more critical events occurring (e.g. system warnings) that may not be picked up by the load test tool as your system may still be returning valid responses. However, you should investigate these so that you fully understand how your system is behaving under load.
-
Deeper Performance Analysis: While your load test tool will give you an overall response time, you might want to understand how it breaks down across your application components. Is too much time being spent in the DB vs in your application business logic… is your load balancer running at full capacity and causing performance issues? Logging is a great way to track this information and your web server, application servers and DBs will often provide this information for free without you having to modify any of your own logging. That being said, if you can log response times from within your application you will get an even more fine-grained view of what is happening. Once you understand where the bottleneck is in your system you can then go to work on optimizing this part of the application so that your application scales further.
-
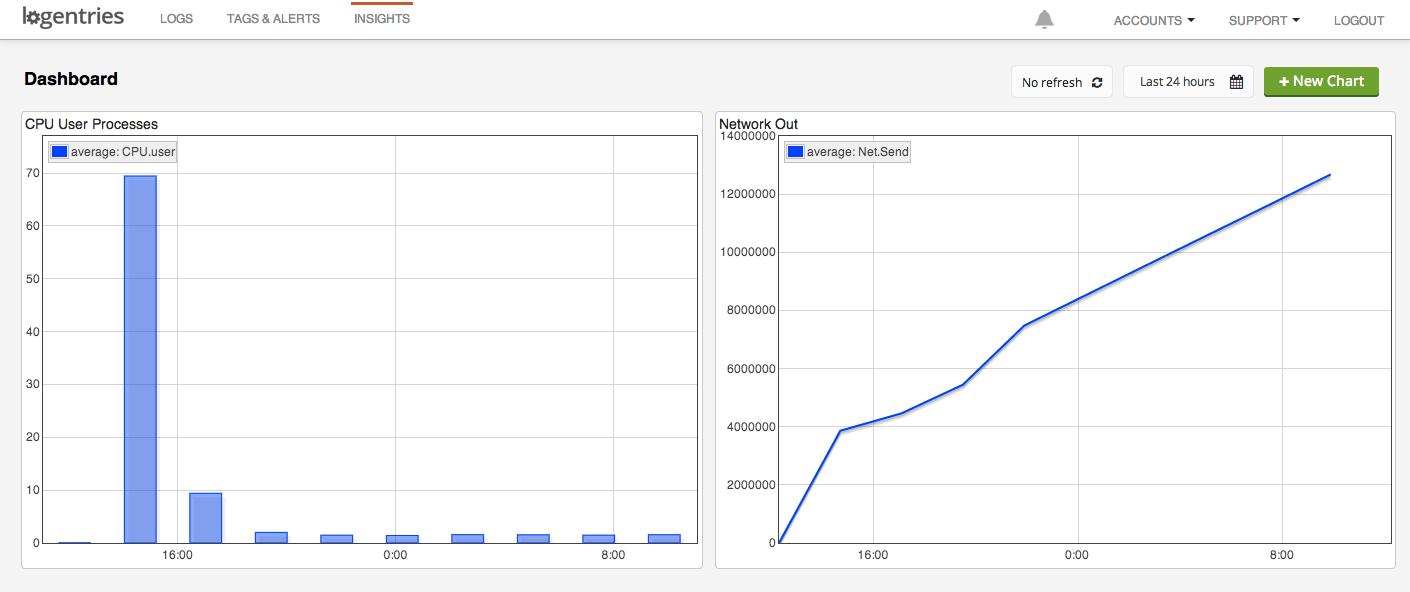
Capacity Analysis and Planning: Load testing is often performed to better understand the infrastructure requirements that will need to be acted on in the case of increased system load. So during load testing, as you watch out for movements in response time and error rates you will also want to have one eye fixed on your resource usage so you can understand if your are close to exceeding capacity. Logentries can automatically collect server monitoring information for you and feed it into a log file stream in your logentries account. You can visualize this data and easily cross correlate it with your system performance and error rates to give you a complete picture of what is happening as resources become scarce. Furthermore this will give you an indication as to at what point you will need to increase your system capacity whether that is by simply kicking off more server instances, or maybe upgrading your infrastructure to make use of larger instances for example.
In summary, log data will help you understand if your load test has passed or failed, what performance looked like for the end user during the test run and where the bottlenecks in your system are. If you are interested in checking out our recent webinar with BlazeMeter on this topic we’ve made it available here.