Last updated at Tue, 31 Oct 2017 19:03:57 GMT
Server resource usage information is a key data point that is critical for any Operations/DevOps team. I like to think of server resource usage information as analogous to the dashboard of your car — it can tell you if you are running out of gas or if something is overheating your system. Similarly, if you keep a record of your server metrics you can also use them to investigate and debug issues in your systems, understand performance trends as well as use in capacity planning over time.
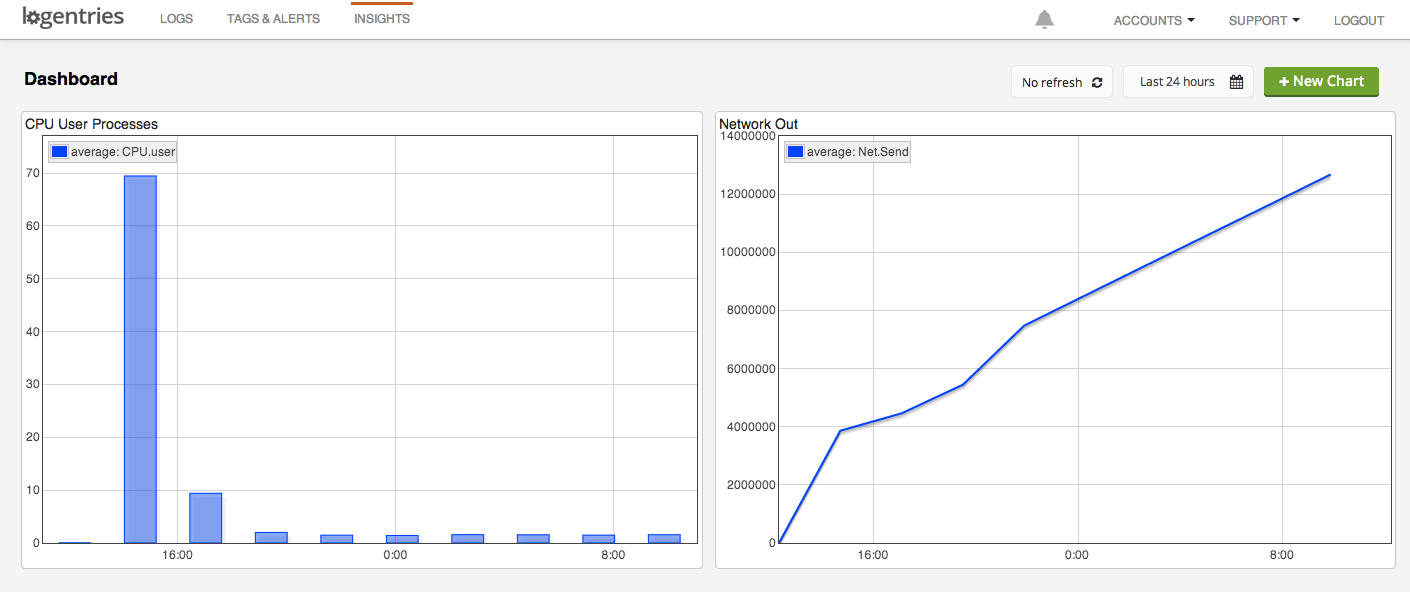 Today we are announcing that Logentries will now capture server resource usage information for Linux and Windows systems and provide this information along-side your “regular” log data. How’s this different to a traditional server monitoring tool? Well, not only do we capture server metrics and allow you to aggregate them to see trends over time, but we store this data in an automatically generated log file – so now you can also maintain the evidence!! If you want to investigate issues related to server performance, you can drill down and investigate the logs to get a fine-grained view of what is going on and also look back over this data historically as needed. You can also dynamically correlate and aggregate resource usage information with application exceptions or system errors to pinpoint the root cause of an issue.
Here’s a few reasons why we think this is going to be pretty useful:
• All your logs and server metrics in one place: I’ve had many of our users ask me something along the lines of: ‘hey why don’t you grab my server metrics and feed these into my logentries account – I’m sick of having to log into multiple dashboards to get an understanding for what’s going on in my system’. Having your application and system logs in one place alongside your server metrics means you have one less tool to log into and pay for!
• Monitoring and troubleshooting production issues: A recent survey we carried out showed production monitoring as one of the top use cases for log data. While logs can give you a view into your system and application behavior, combining this with server resource usage metrics can give you the full picture. For example one of the first things you will/should check if there is a system issue is your resource usage information e.g. are you running out of memory/CPU/disk. If you are maxing out some of your resources a quick fix may be to simply kick off some additional server instances to spread the load. Also correlating a spike in CPU with a spike in application exceptions for example can help you identify what specific application behaviors are causing your resources to get maxed out – so that you can then go about patching the issue.
• Capacity planning, performance analysis and load testing: Load testing and capacity planning are key activities you should carry out if you want to gain an understanding of how your system will react as your user load increases. Tools like Blazemeter for example can be used to simulate load on your system and will allow you to continue to ramp up users so that you can get a view into how your system handles increased volumes. The three data points you will be interested in viewing during a load test are:
-
resource usage: viewing how resources are being used as load increases allows you to understand if your current infrastructure can handle the increased volumes or if you will need additional capacity during busy periods.
-
system performance: understanding if response times continue to be acceptable gives you visibility into what your users experience will be like if system load increases.
-
system errors: tracking errors and exceptions can tell you if your load test passed or failed – i.e. could the system handle the load without crashing or without users experiencing errors.
As always let us know if you find this new feature useful or if there are additional use cases that you use server monitoring metrics for!