Last updated at Wed, 01 Nov 2017 20:49:46 GMT
The world of log management and application performance monitoring are evolving and there is no longer a big distinction between the two.
Up to even a year ago, many people in IT viewed logs as simply a means of identifying and tracking issues once they have occurred within their system. It was rare that people were using their logs for more than basic application event tracking and watching for exceptions.
But over the last year I’ve seen huge growth in the adoption of utilizing machine generated logs for more advanced data capture. People now recognize the benefits of having important event and application data all stored in easy-to-ingest log data format; users are no longer restricted to basic metrics from traditional application monitoring tools and can get the best of both worlds in a single tool (Logentries – 🙂 ), with the ability to drill down from the high level metrics to the individual events and associated details.
Part of this evolution is due to the advancements in the log management tools, which have expanded their toolsets to allow much more advanced data extraction and consolidation capabilities.
One such example of this shareable dashboards, which allow you to export metrics you extract from your logs.
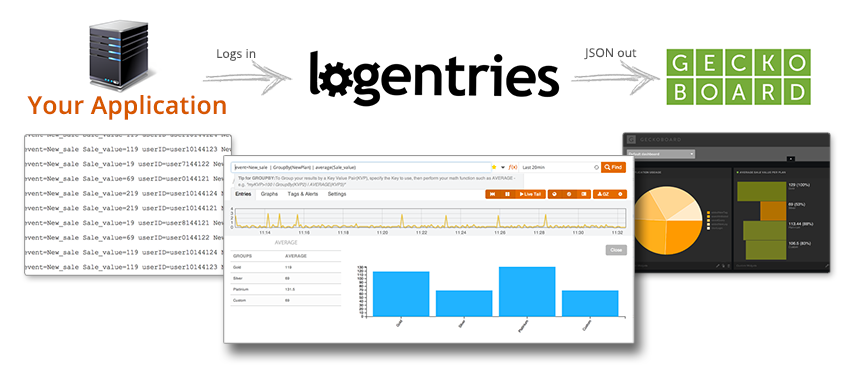
This is achieved in a few basic steps.
1: Send logs to Logentries which contain important events you want to generate metrics from (best to have this in Key Value pairs).
e.g. event=NewSale customer=ABC item=AB1 itemcatagory=XY SaleValue=123
2: Extract the data you want using our queries (this will result in metrics being generated and an easy to use visualization being generated) and save this to a dashboard on Logentries.
Sample query = “event=NewSale | groupby(itemcatagory) | sum(SaleValue)”
This will iterate through the logs looking for log events of type NewSale, it then groups these by the categories and calculates the total value of the sales over the specified time period.
3: Export the metrics as JSON, this is done by simply choosing the graph/visualization on your dashboard and choosing the option to export to JSON/Geckoboard. The system will then generate a unique endpoint such as
https://open.logentries.com/v1/metrics/fedab02f-6535-41a0-b4b9-148c9b079d14/transforms/geckoboard.
Logentries will auto generate new JSON/metrics from your incoming logs at your specified intervals so you can keep up-to-date on the important KVP’s for your business.
Never before has the pipeline from raw logs to custom extracted metrics in a consumable JSON format being so easy to achieve.
This is just one of the cool new aspects of the Logentries service that will be rolling out over the next few months and is focused on making the extraction and consumption of important data easier and faster allowing you to quickly go from high level metrics to individual events in a few clicks. Check out the new Logentries and Geckoboard integration for free in a 30-day trial.