Last updated at Mon, 06 Nov 2017 18:15:57 GMT

One of the most common questions we get asked by customers is:
“What’s the best way to log my data?”
My answer is always:
“log using JSON format wherever possible.”
The next question we often get asked – (but not as much)…
Yeah JSON, …Hmmm, what is JSON again?
So JSON is: JavaScript Object Notation.
But put simply, this is a way that data can be stored in a structured format, where each piece of data will usually have an identifier (known as a key) and a value (which can be in multiple formats). It also can have a nested structure where a key can have multiple children (keys) etc. It is often referred to as a JavaScript version of XML.
The core reason for using JSON is built around the concept of KEY VALUE PAIRS (KVPs) which are ideal because they give you very precise control over the specific data you want to look for or extract and manipulate.
A simple example of three JSON objects as logs could be:
{ "car": { "make": "Ford" "car_details": { "model": "Fiesta" "mileage": 15000 "color": "yellow" "value": 20000 } } } { "car": { "make": "Dodge" "car_details": { "model": "Viper" "mileage": 30000 "color": "yellow" "value": 30000 } } } { "car": { "make": "Ford" "car_details": { "model": "Fiesta" "mileage": 15000 "color": "blue" "value": 20000 } } }
(Don’t forget you can send in any log data in Key Value Pairs and utilize our key highlighting and enhanced search functions.)
You can start to use the Keys to help you slice and dice the log data to your heart’s content.
So, some simple queries you could run:
How many ford cars were sold.
Where(car and make=Ford) Calculate(count)
Or
Ge****t the total value of Ford cars sold
Where(car and make=Ford) Calculate(sum:value)
Or
Find the total of cars sold by make
Where(car) GroupBy(make) Calculate(sum:value)
All this is easy to do and achieve by using the simple JSON format.
As I hope you can see, by having your logs in JSON or KVP format give you a huge amount of control in how you slice and dice the data within your logs to gain the insight you want.
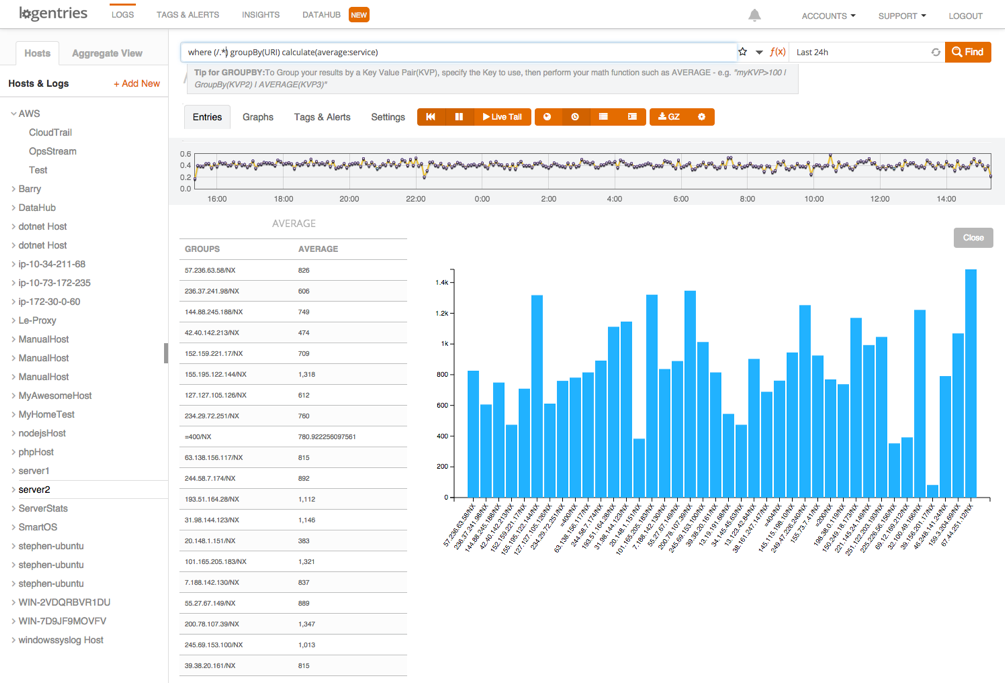
A real world example based on a Apache web log could be
How long is the average response time based on URI
This would be written as
Where(/.*) GroupBy(Uri) calculate(Average:Request_Time)
From which you would get a great visualisation.
But hey, the fun of working with JSON doesn’t end there…
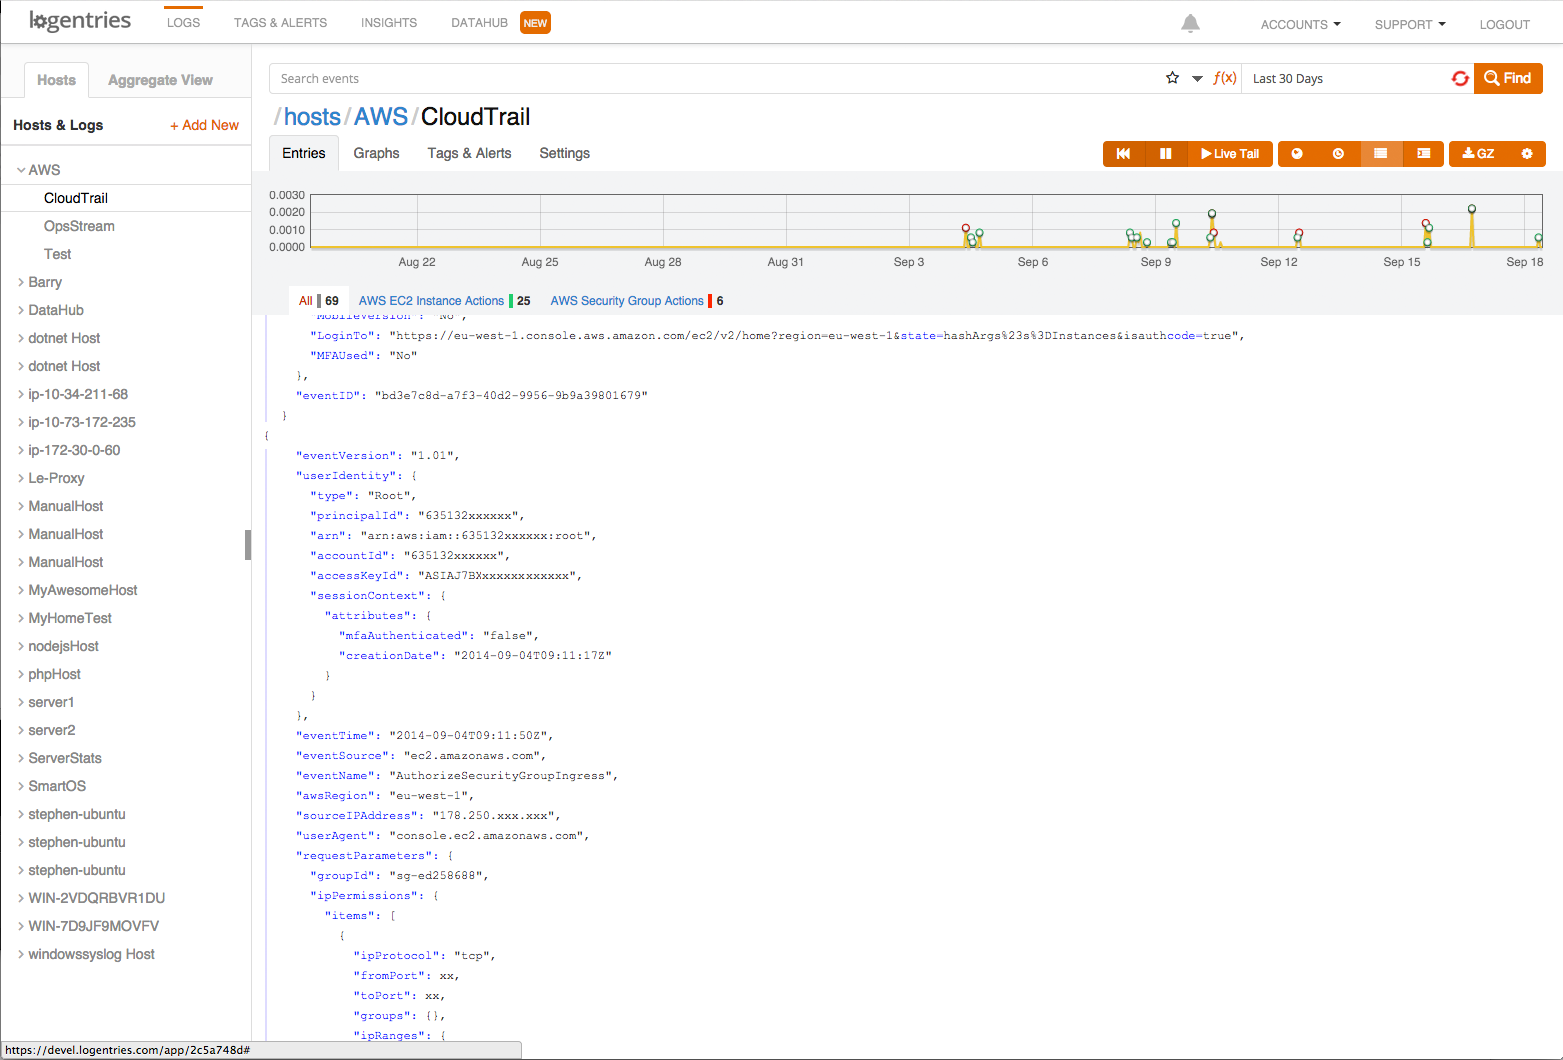
Because you can have a hierarchal format within your log events, we can expose this parent-child relationship within the log viewport, and make it much easier to read and visualize the log events.
We have also added a new neat little function called “Expand JSON” which, when activated, will transform your blob of JSON into its own easily readable indented structure.
See the comparison of the humble JSON log event below, before and after the “prettifying”.
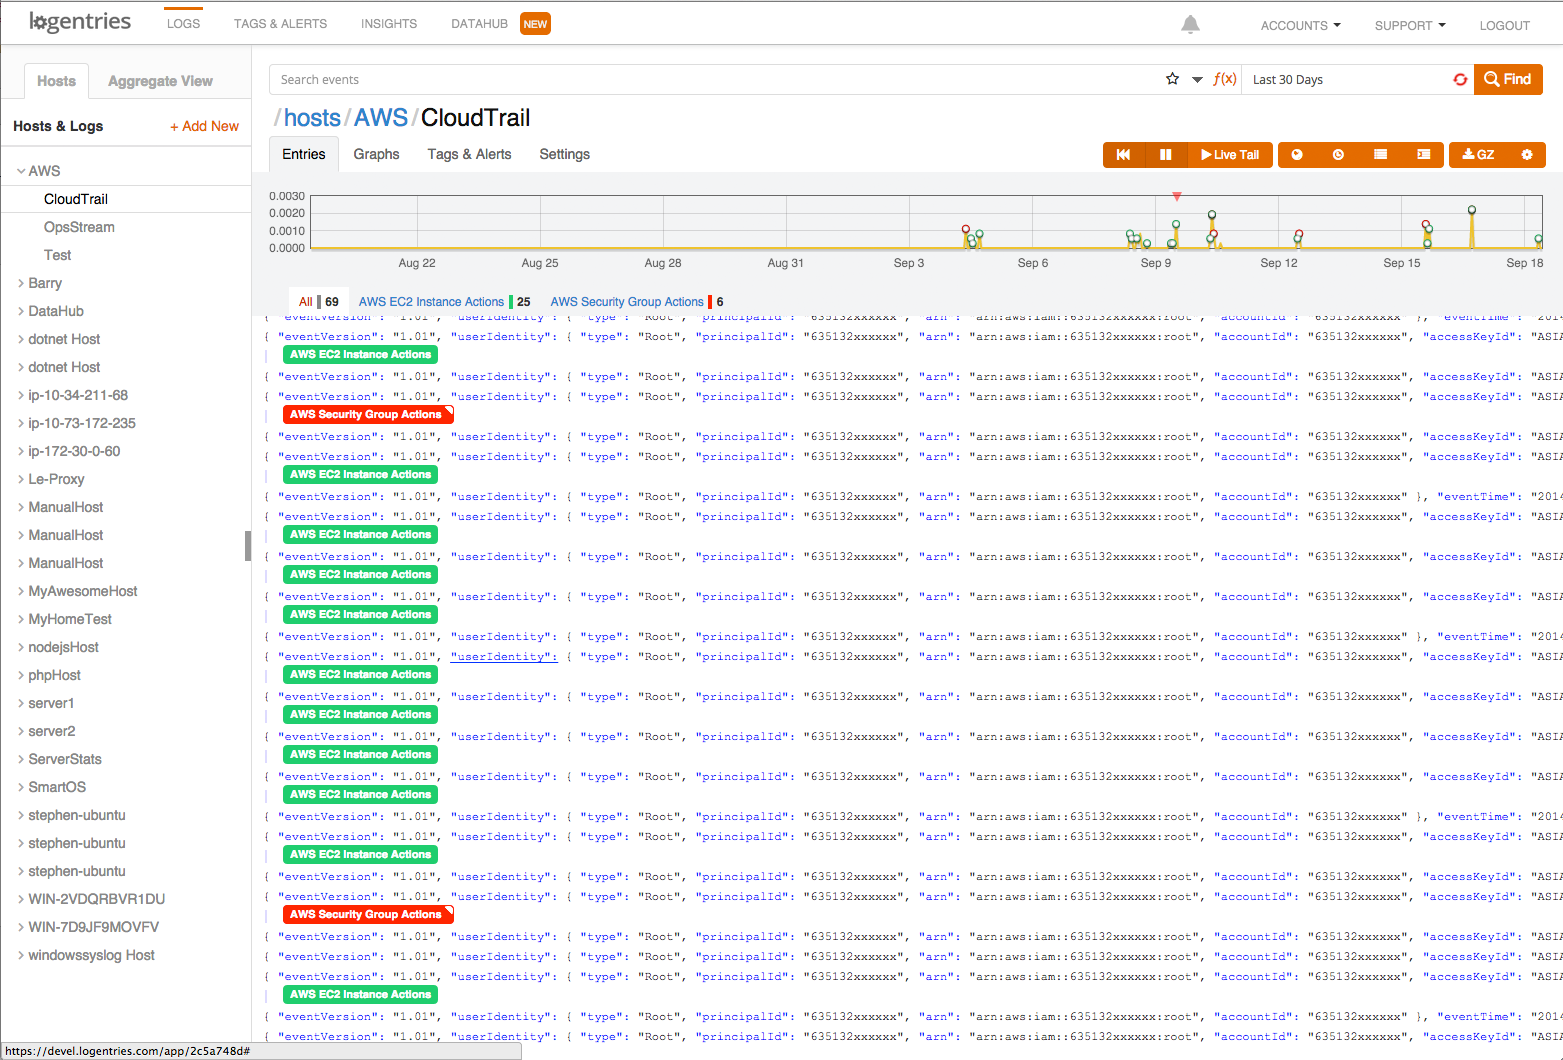 Before
You may think were finished – but wait, there’s more.
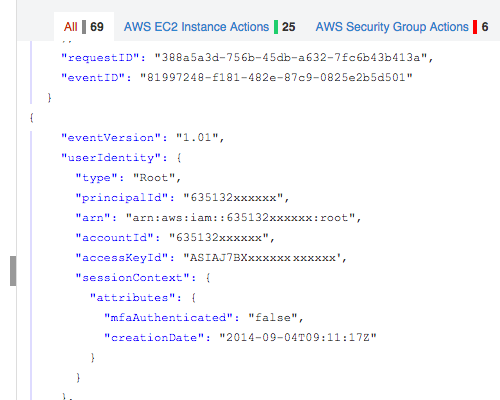
We have now also released key highlighting within your logs to make it easier for you to quickly utilize the keys. By simply clicking on keys you can quickly refine the logs selected and counted for the selected time range to only logs that contain the specific key.
It also highlights the keys that you can use for cutting and dicing the log data.
 This is just our first step on a much longer road exposing new functionality around Keys and JSON which we hope will make it easier and quicker for you to navigate and gain the insight you need from your log data.
Over the next few months we will be releasing more cool functionality like, but in the meantime, if you have any feedback or suggestions on the enw Key exposure and JSON formatting we would love to hear it. Email us at suggest@logentries.com.
