Last updated at Mon, 06 Nov 2017 20:36:35 GMT

In the previous blog post we learned how to send IoT data from the TI CC 2650 SensorTag to Logentries using Node-Red and directly using Linux. This Blog will show how to send data from a Raspberry Pi device to Logentries in real time for two main use cases:
- Raspberry Pi system logs.
- Raspberry Pi metrics.
- Sample data from a Sensor.
A future blog will extend item 3 to show how a Raspberry Pi can be used as an IoT gateway and send data from multiple devices to Logentries.
The newest Raspberry Pi 3, released in February 2016 is powered by 1.2GHz 64-bit quad-core ARM CPU, 1GB RAM, 802.11n WLAN and Bluetooth Low Energy. The Pi’s computing power and wireless communication capabilities make a great addition to the Internet of Things (IoT) world, as it easily enables a range of device-to-device data exchange and intelligent environments that depend on smart devices communicating with each other in order to collect vast amounts of data in real time. The Raspberry Pi is powered by Raspbian – a free operating system based on Debian optimized for this specific piece of hardware. Debian-based systems automatically create log files, such as auth.log, user.log or syslog messages.
Sending log data from the Raspberry Pi
- Download Logentries agent source code and go into source directory as below:
git clone git://github.com/logentries/le.git
cd le/src
- (you can set up a free trial account!).
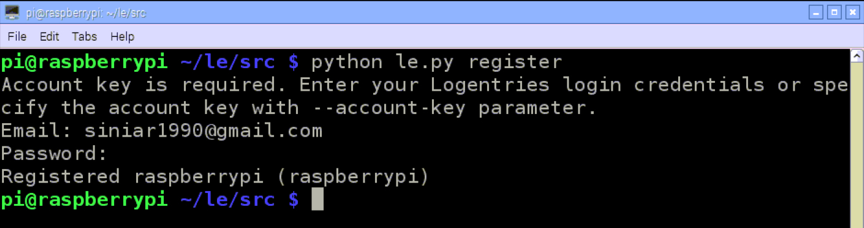
Now, you can simply do “Add a log” in the browser and select Syslog, which will instruct you how to set up your .conf file to send logs to Logentries, but we will show here how to use the agent to send logs from several log files.. Register an agent
python le.py register
3. Decide on log files you would like to follow (e.g. messages) python le.py follow /var/log/messages
4. Start monitoring python le.py monitor
5. We’re done! Log data from messages file will now be sent to your Logentries account.
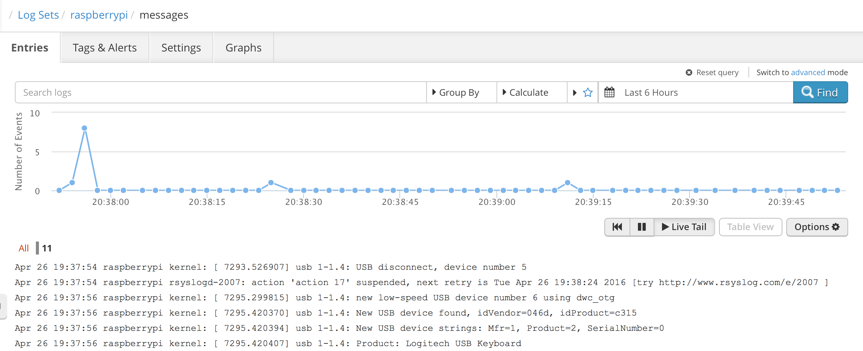
In this example, we learned how to monitor messages file. Naturally, we can add more log files to follow by running:
python le.py follow <FILE_TO_FOLLOW>
python le.py monitor
Sending metrics data from the Raspberry Pi
In order to track the performance of all nodes in terms of CPU, memory and disk usage, the Logentries package includes pre-installed metrics class in the source folder that can be used to carry out the aggregation of data and analysis of Raspbery Pi system performance. The metrics class requires the psutil library, which can be installed with:
sudo apt-get install gcc python-dev
sudo pip install psutil
Next, we create a log file for the metrics data and set the agent to follow that file and send metrics to it. This can be simply achieved by:
touch /home/pi/Desktop/metrics.log
cd le/src
python le.py follow /home/pi/Desktop/metrics.log
python le.py monitor
python metrics.py &> /home/pi/Desktop/metrics.log &
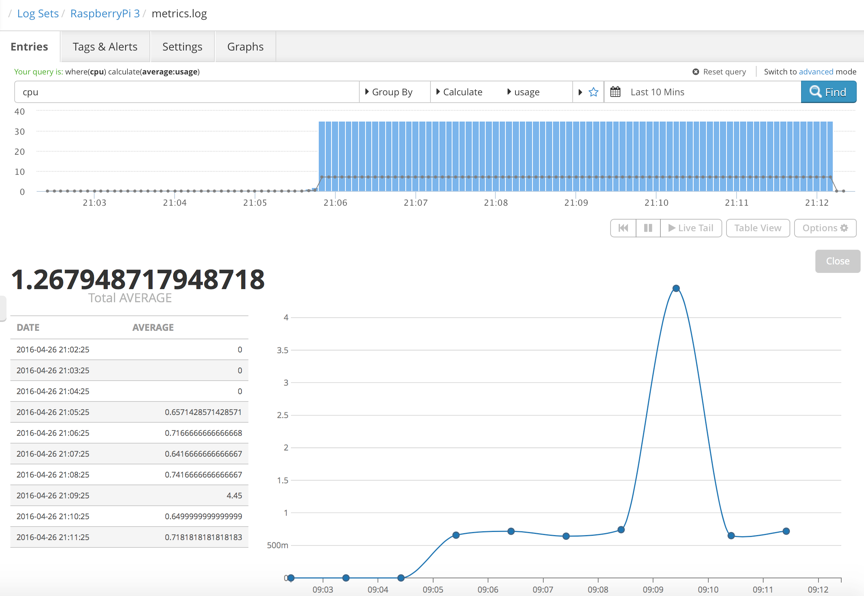
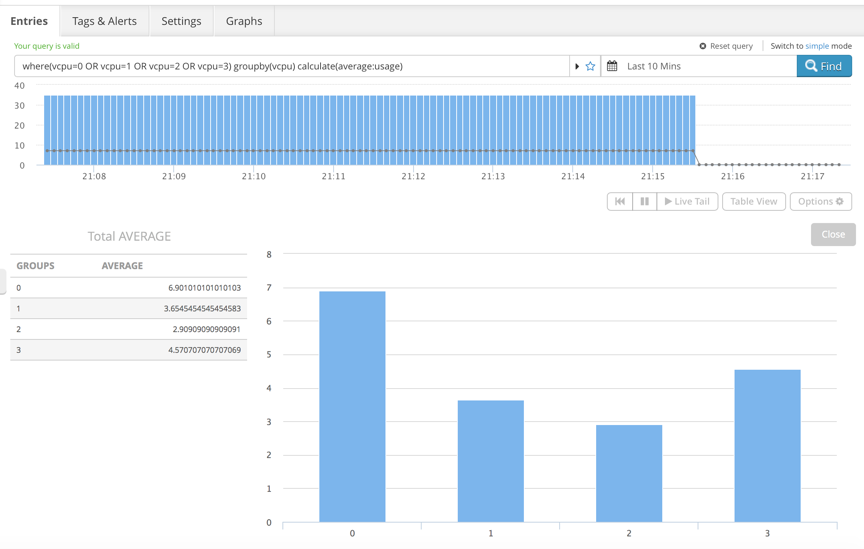
We can use aggregated data and the Logentries Query Language (LEQL) to spin up performance graphs in seconds, see earlier Blog on LEQL. Below are two examples for total and per-core average CPU usage.
where(cpu) calculate(average:usage)
where(vcpu=O OR vcpu=1 OR vcpu=2 ORvcpu=3) groupby(vcpu) calculate(average:usage)
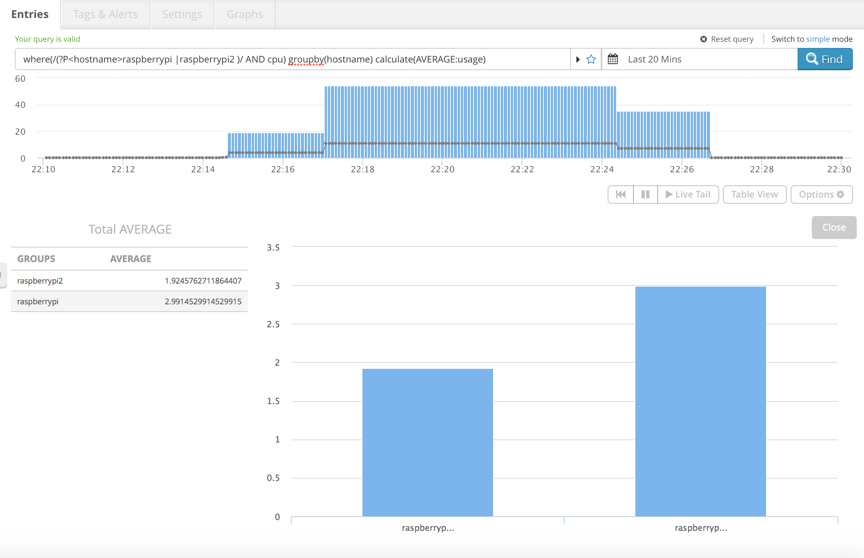
Let’s take another step forward and hook up a second Raspberry Pi device to the same Logentries account. Using the power of regex and LEQL, we can build a query to visualize the comparison of the average CPU usage for both devices in real time and see how useful this would be to monitor Rapsberry Pi and IoT nodes in a scalable environment.
where(/(?P<hostname>raspberrypi |raspberrypi2 )/ AND cpu) groupby(hostname) calculate(AVERAGE:usage)
Sending sensor data from the Raspberry Pi
IoT applications such as smart homes, smart cities and vehicles will need to use a number of distributed sensors with a single gateway/controller. A future Blog will show the use of a PI as a gateway, but we will show here how easy it is to send sensor data to Logentries using a Raspberry Pi:
- Install Python library for Logentries:
sudo pip install logentries - Go to Logentries.com, log in to your dashboard - Click on “+Add new” button, then “Add a log” and choose “Manual”.
- You will have to enter a Log Name, for example “MySensor data”, select “Token TCP” and click on “Create Log Token” button.
- Please make sure you make a note of the new token generated at the bottom of the page
- For a simple example, we simulate a water detection scenario using a commodity rain sensor available on Amazon, eBay, etc.
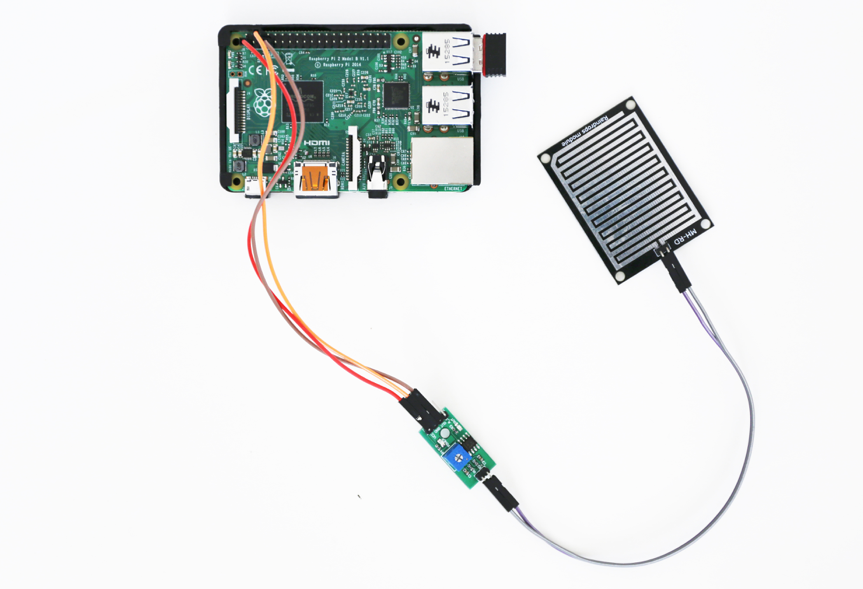
Only a few lines of Python code are required to get this system up and running and sending readings to Logentries:
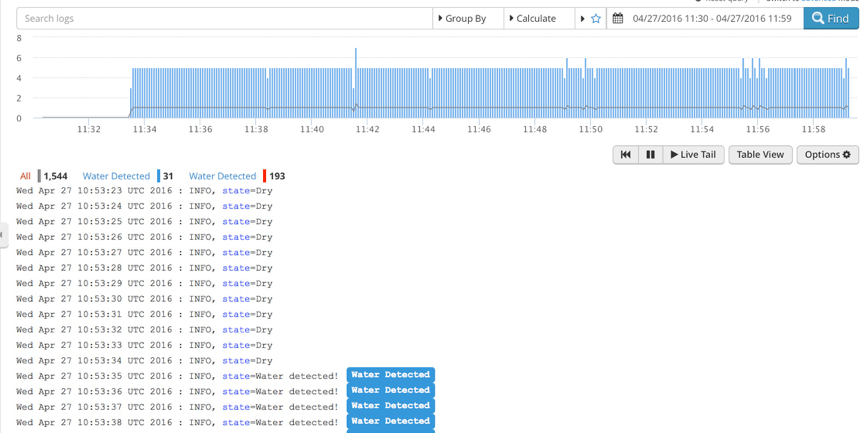
This short script runs on our Raspberry Pi device with the rain sensor connected to GPIO pin 4. Log data is sent to the Logentries dashboard every second. We can show the state changes easily with the following steps:
- Create an alert in “Tags & Alert” tab, shown below with label “Water Detected”.
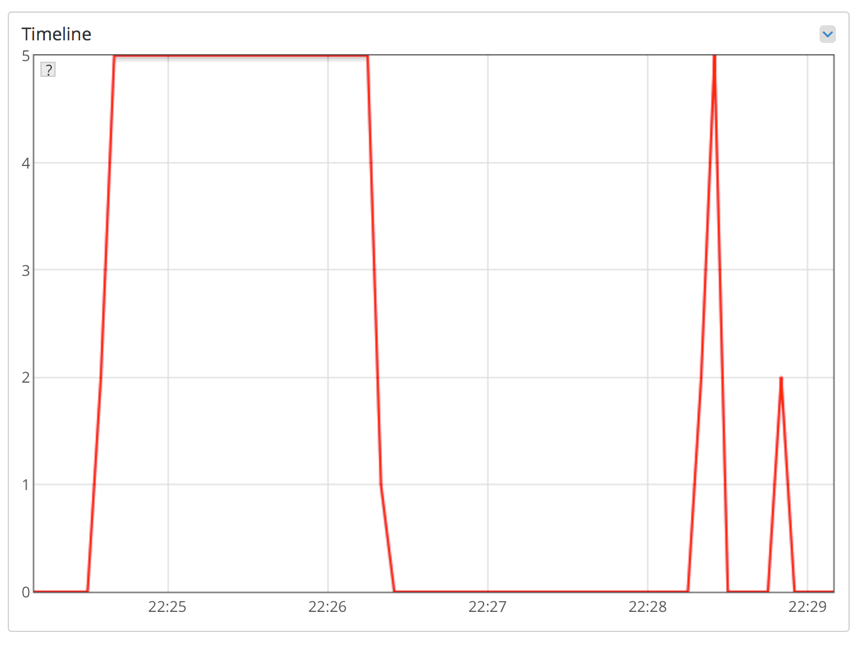
- Click the “Graphs” tab in the UI, create a timeline line chart widget and select the tag you created in the “New Widget” window.
The spillage of liquid on the rain sensor results in the output graph depicted below, where spikes represent liquid being detected.
Future Blogs….
Now that we have seen how easy it is to send data from the Pi to Logentries, the next blog will show how to configure the PI to act as an IoT gateway for multiple devices and send their data to Logentries.