Last updated at Mon, 06 Nov 2017 20:48:38 GMT
Our webinar was broadcasted & recorded on June 16th 2016. During this broadcast Tableau Zen Master Mike Roberts of Pluralsight discussed how to develop a simple technology stack for next-gen management of Tableau using Logentries. Mike was joined by Trevor Parsons, Senior Director, Log Management & Search at Rapid7. The broadcast concluded with a live Q&A session.
Below is a brief summary of some of the topics Mike and Trevor covered. To watch a recording of the full webinar on-demand, click here.
The Tableau Technology Stack: A.I.M.
The ideal Tableau Technology stack consists of three pillars:
- Alert
- Integrate
- Monitor
View the full recording to learn more about each pillar of the ideal stack and to see the associated demonstration for each pillar.
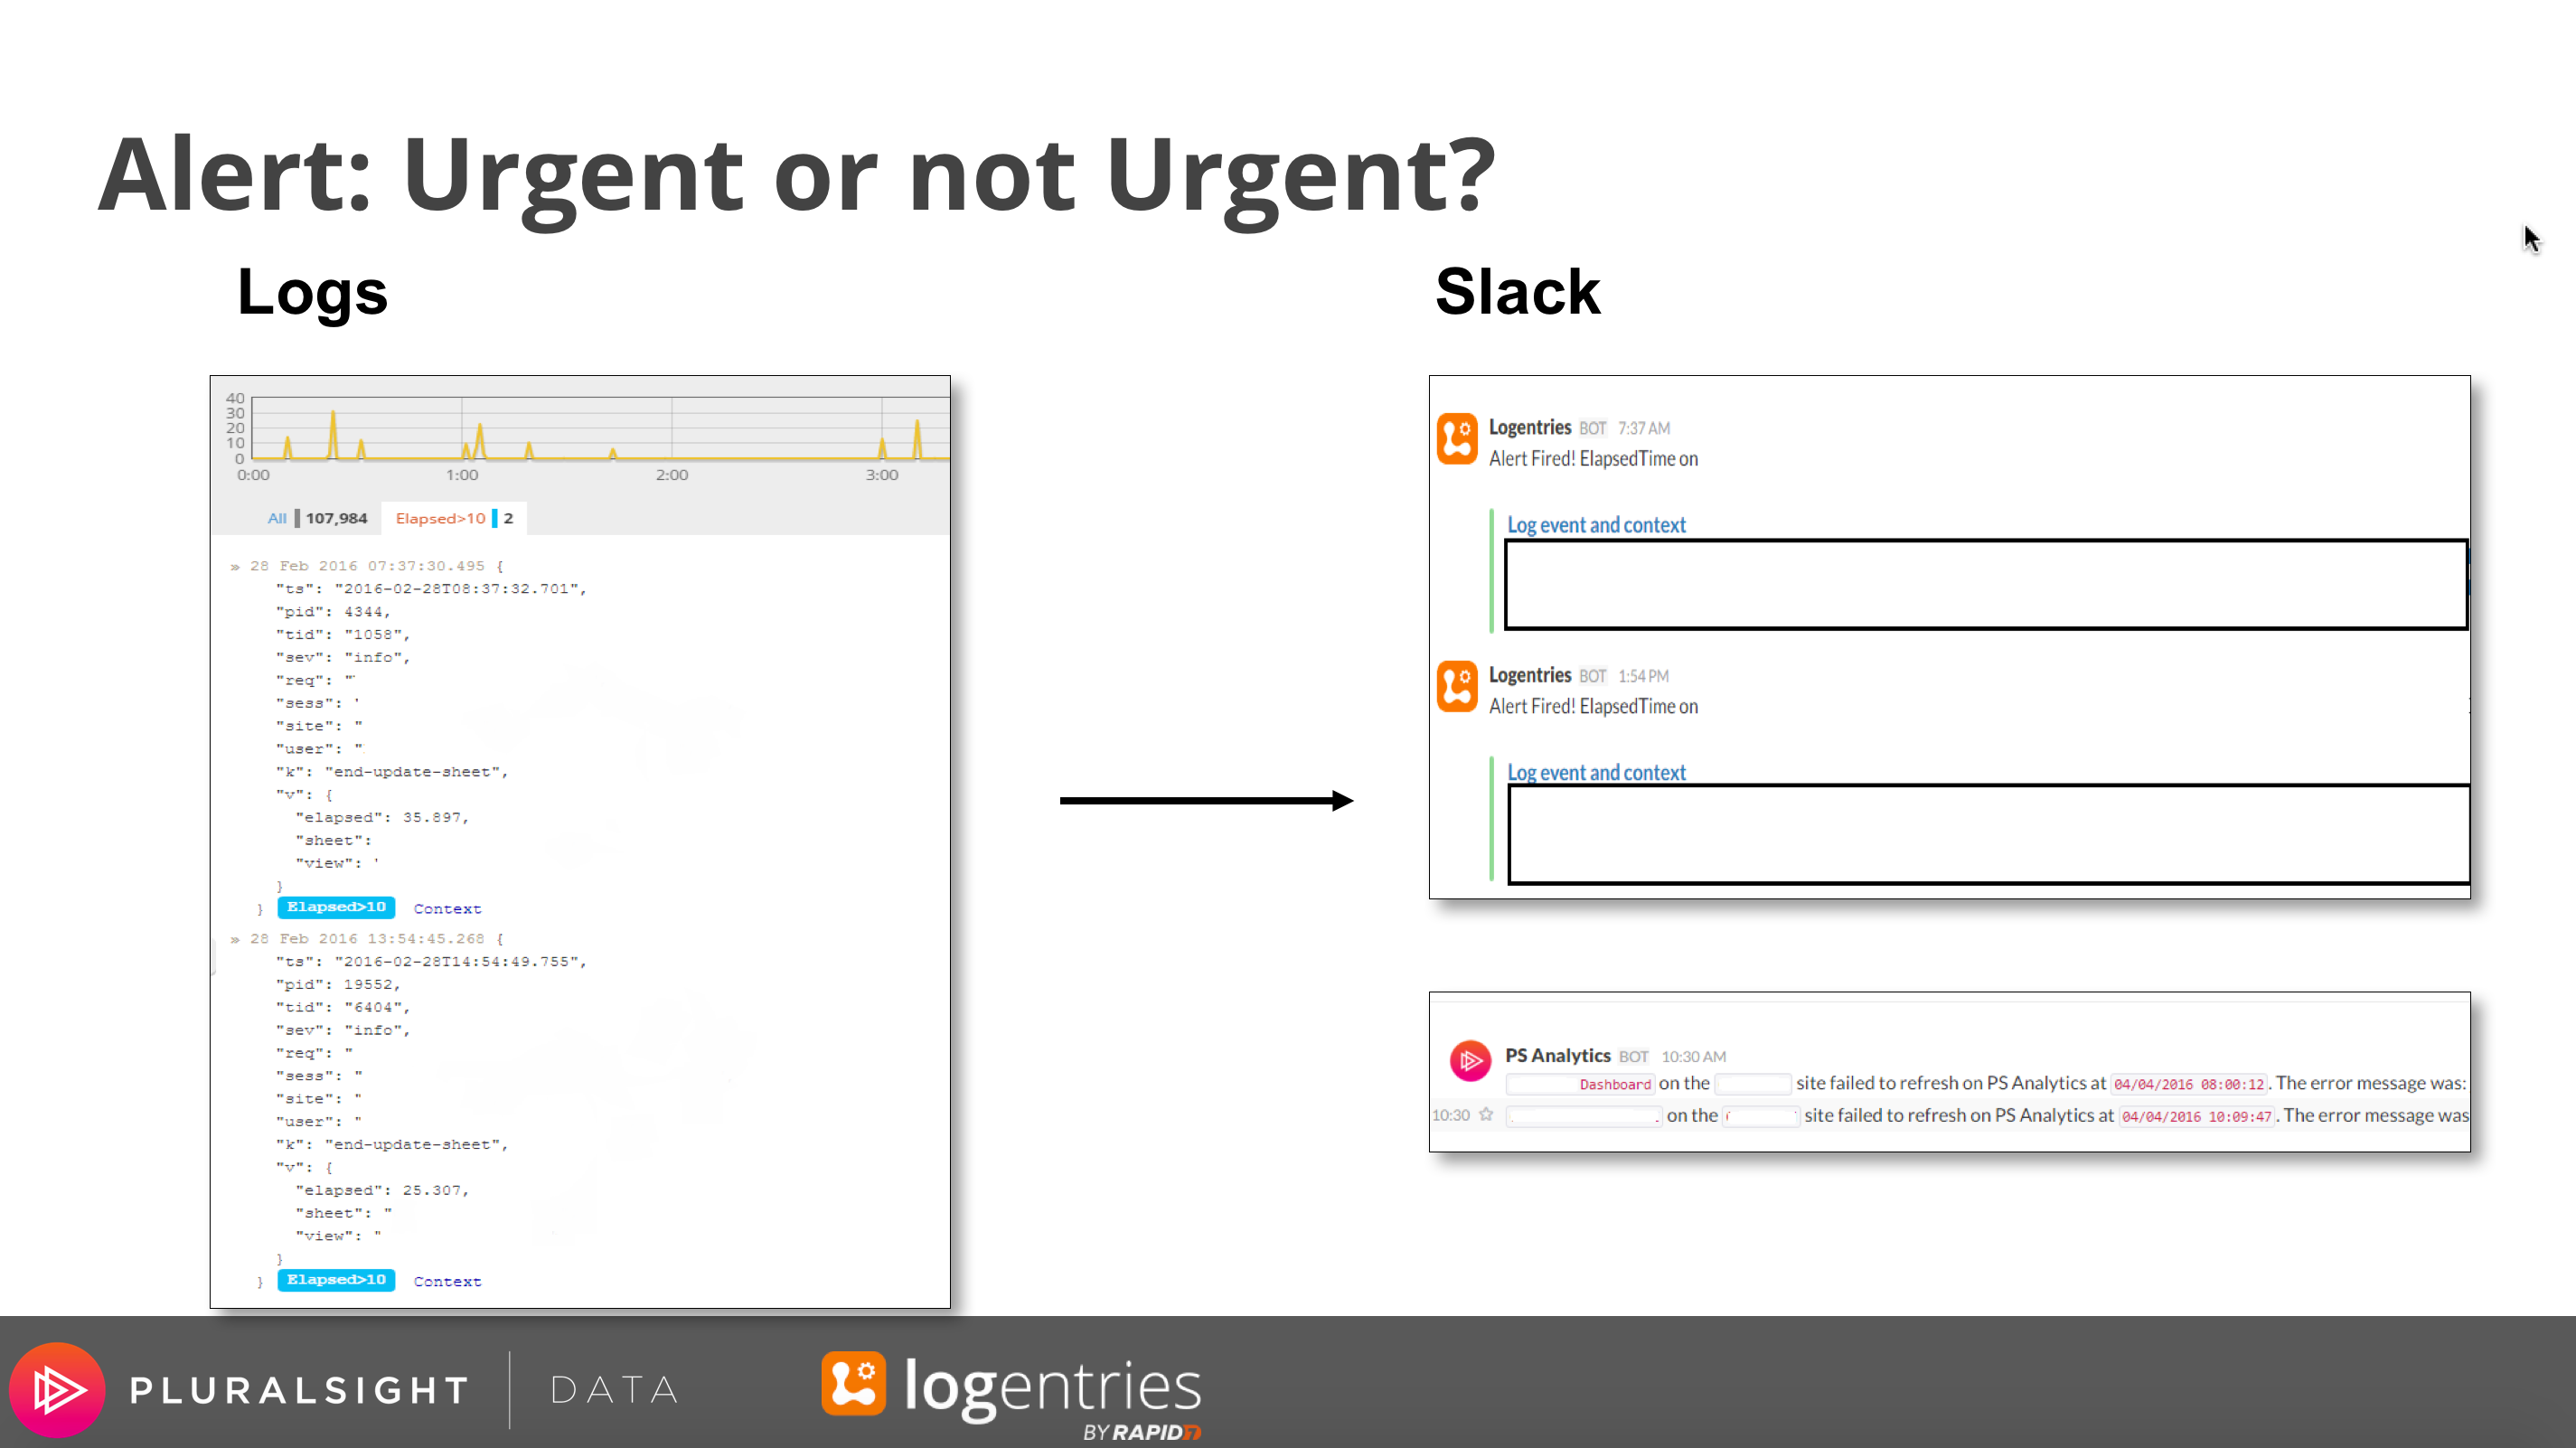
Alert
Alerting on key events within your Tableau environment can notify you when the system is experiencing technical difficulties and also when there are opportunities for improvement.
A log management solution like Logentries allows you to easily configure alerts based on patterns and events. In the example below when a Tableau site failed to refresh the Operations Team was notified via Slack.
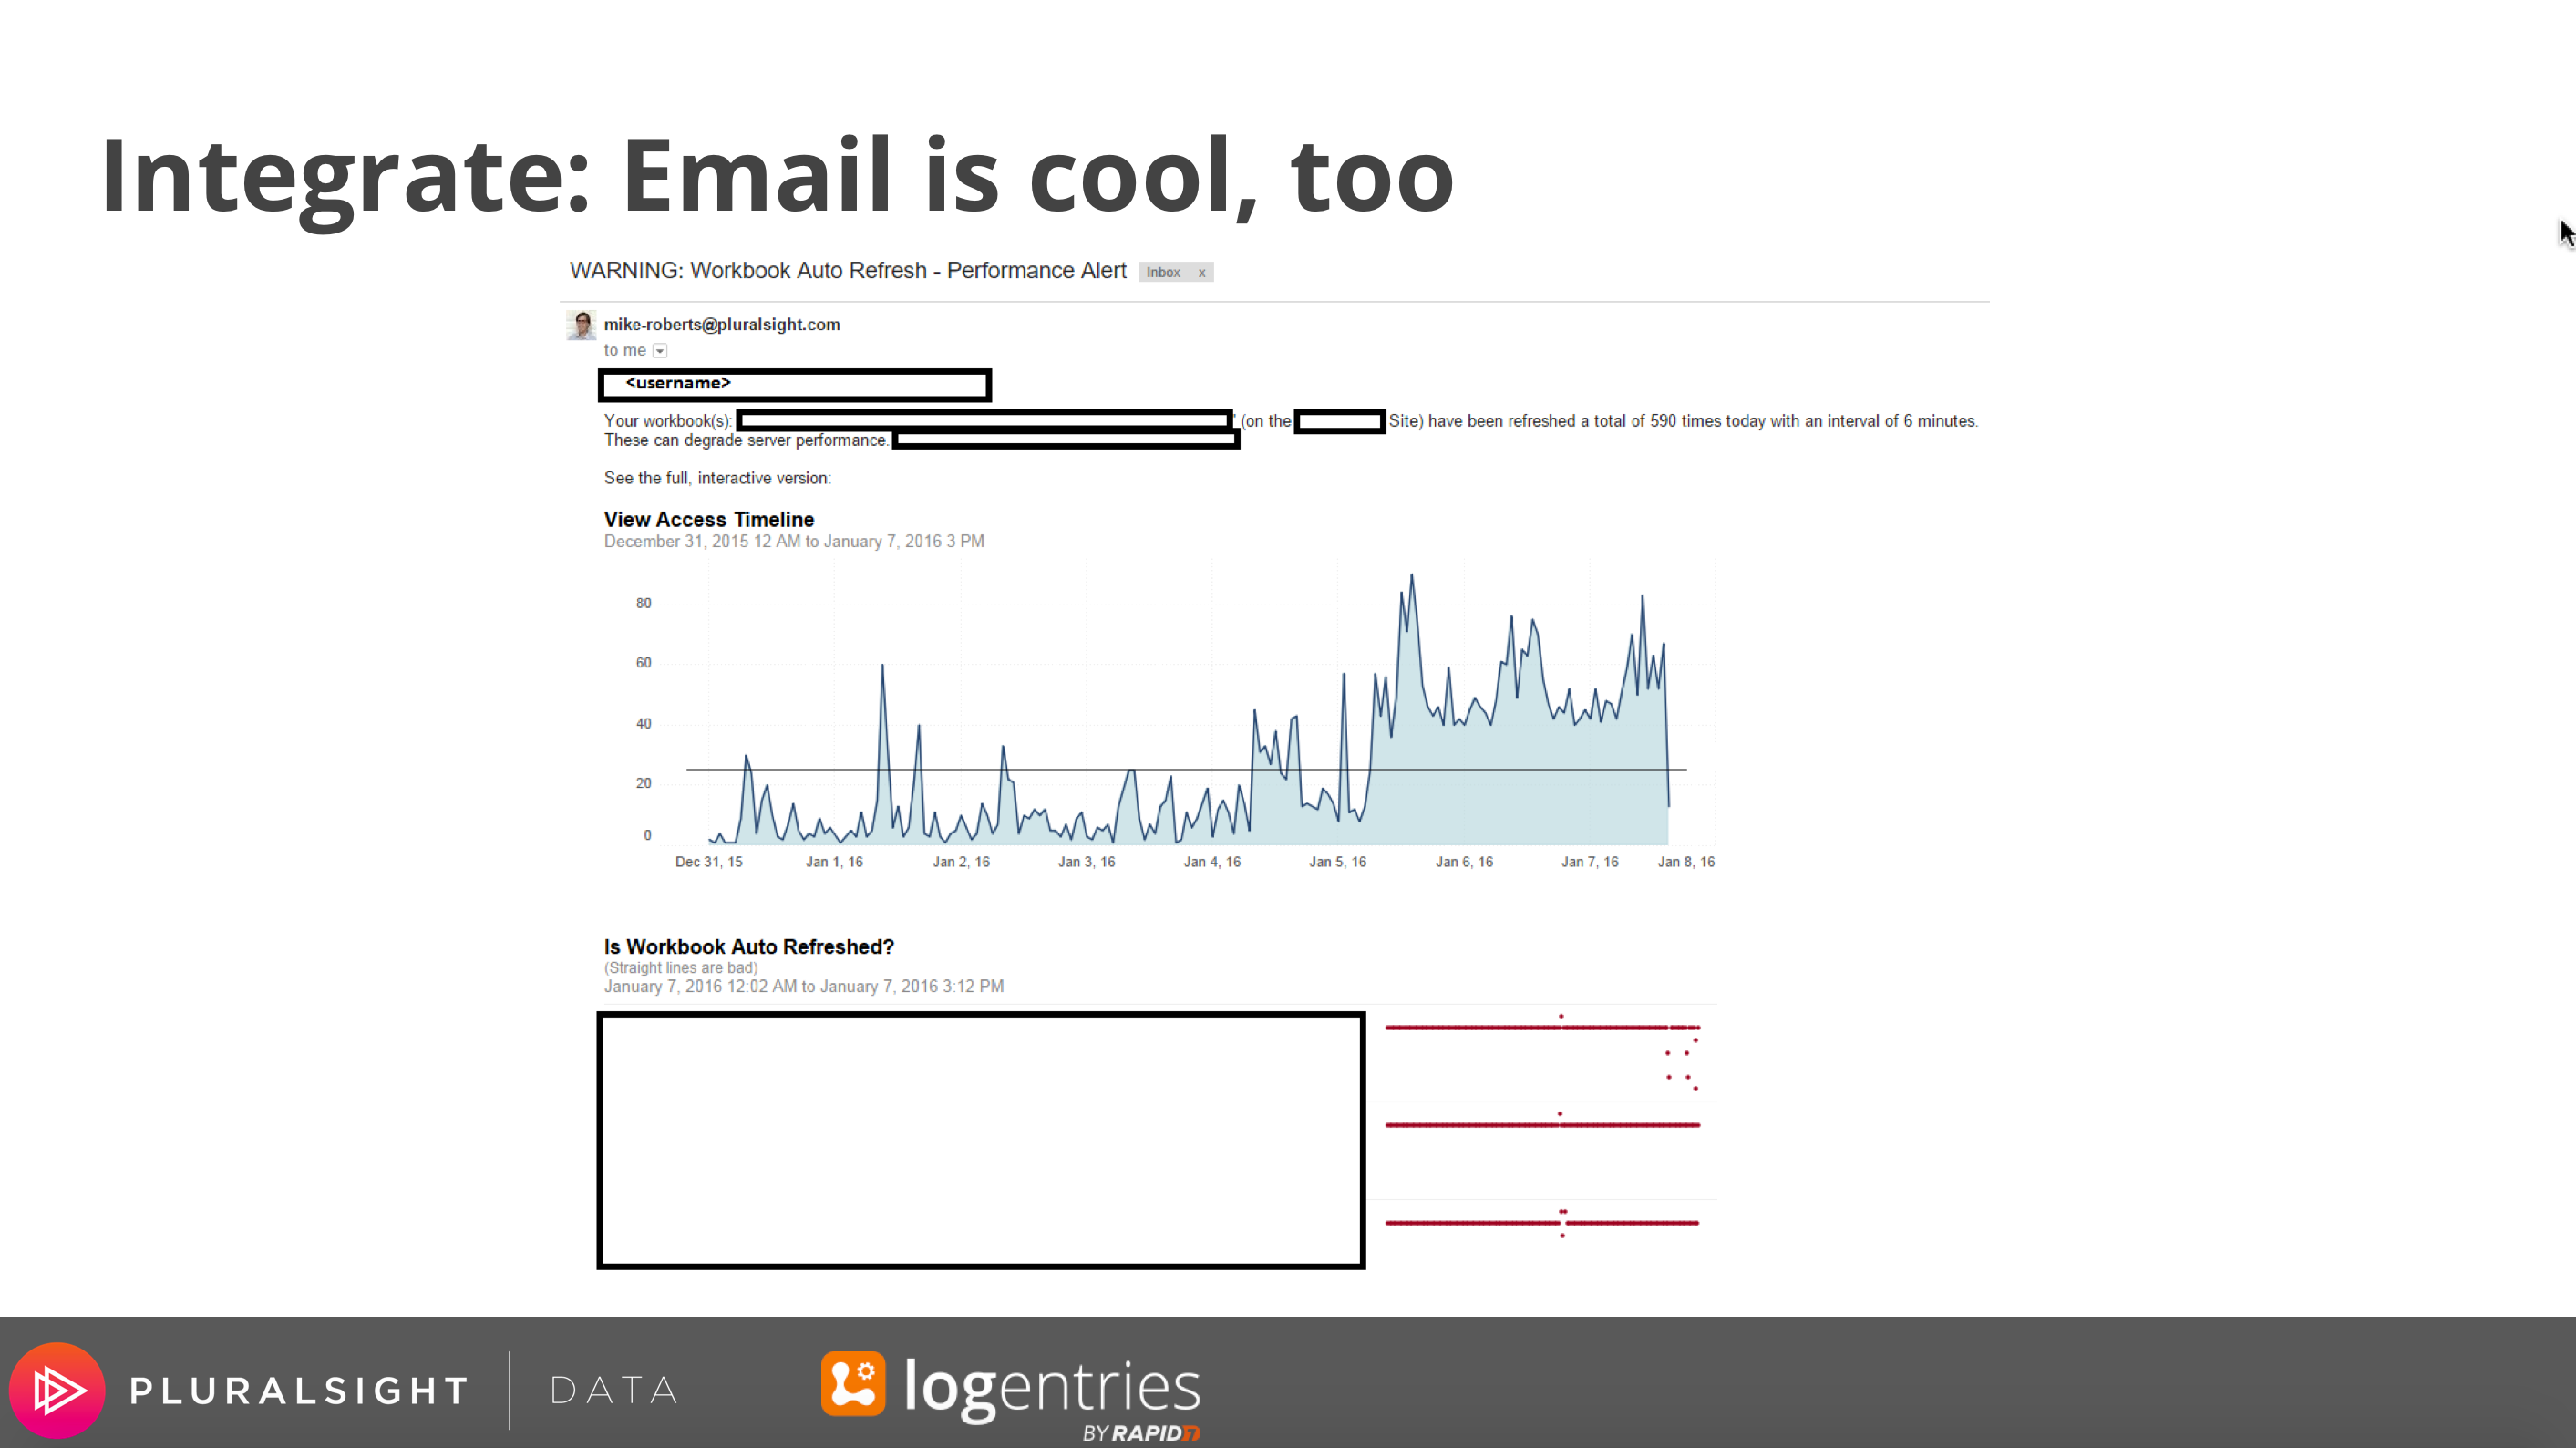
Integrate
The ideal Tableau stack is not exclusively Logentries and Tableau. This ecosystem includes other integrations such as Slack, PagerDuty, and email.
Slack is the primary integration used by Mike Roberts and his team. System health is conveyed through group Slack rooms and recommendations for workbook improvement are automatically communicated as private messages to individual Tableau users.
Mike has also built an impressive integration with email. The example below is an email delivered to a user that is refreshing their workbook at an abnormally frequent rate.
Monitor
Almost all of the Tableau logs you will be interested in for analytic purposes are located here:
C:\ProgramData\Tableau\Tableau Server\data\tabsvc\logs
The logs in this directory can be easily captured with one of the Logentries agents. Once the Tableau log data is available in Logentries monitoring the Tableau systems is easy. The Logentries Query Language (LEQL) allows you to search through and visualize the log data making it easy to find actionable insights.
The example LEQL query below produces a bar chart showing the Tableau users requesting the most rows in their workbooks.
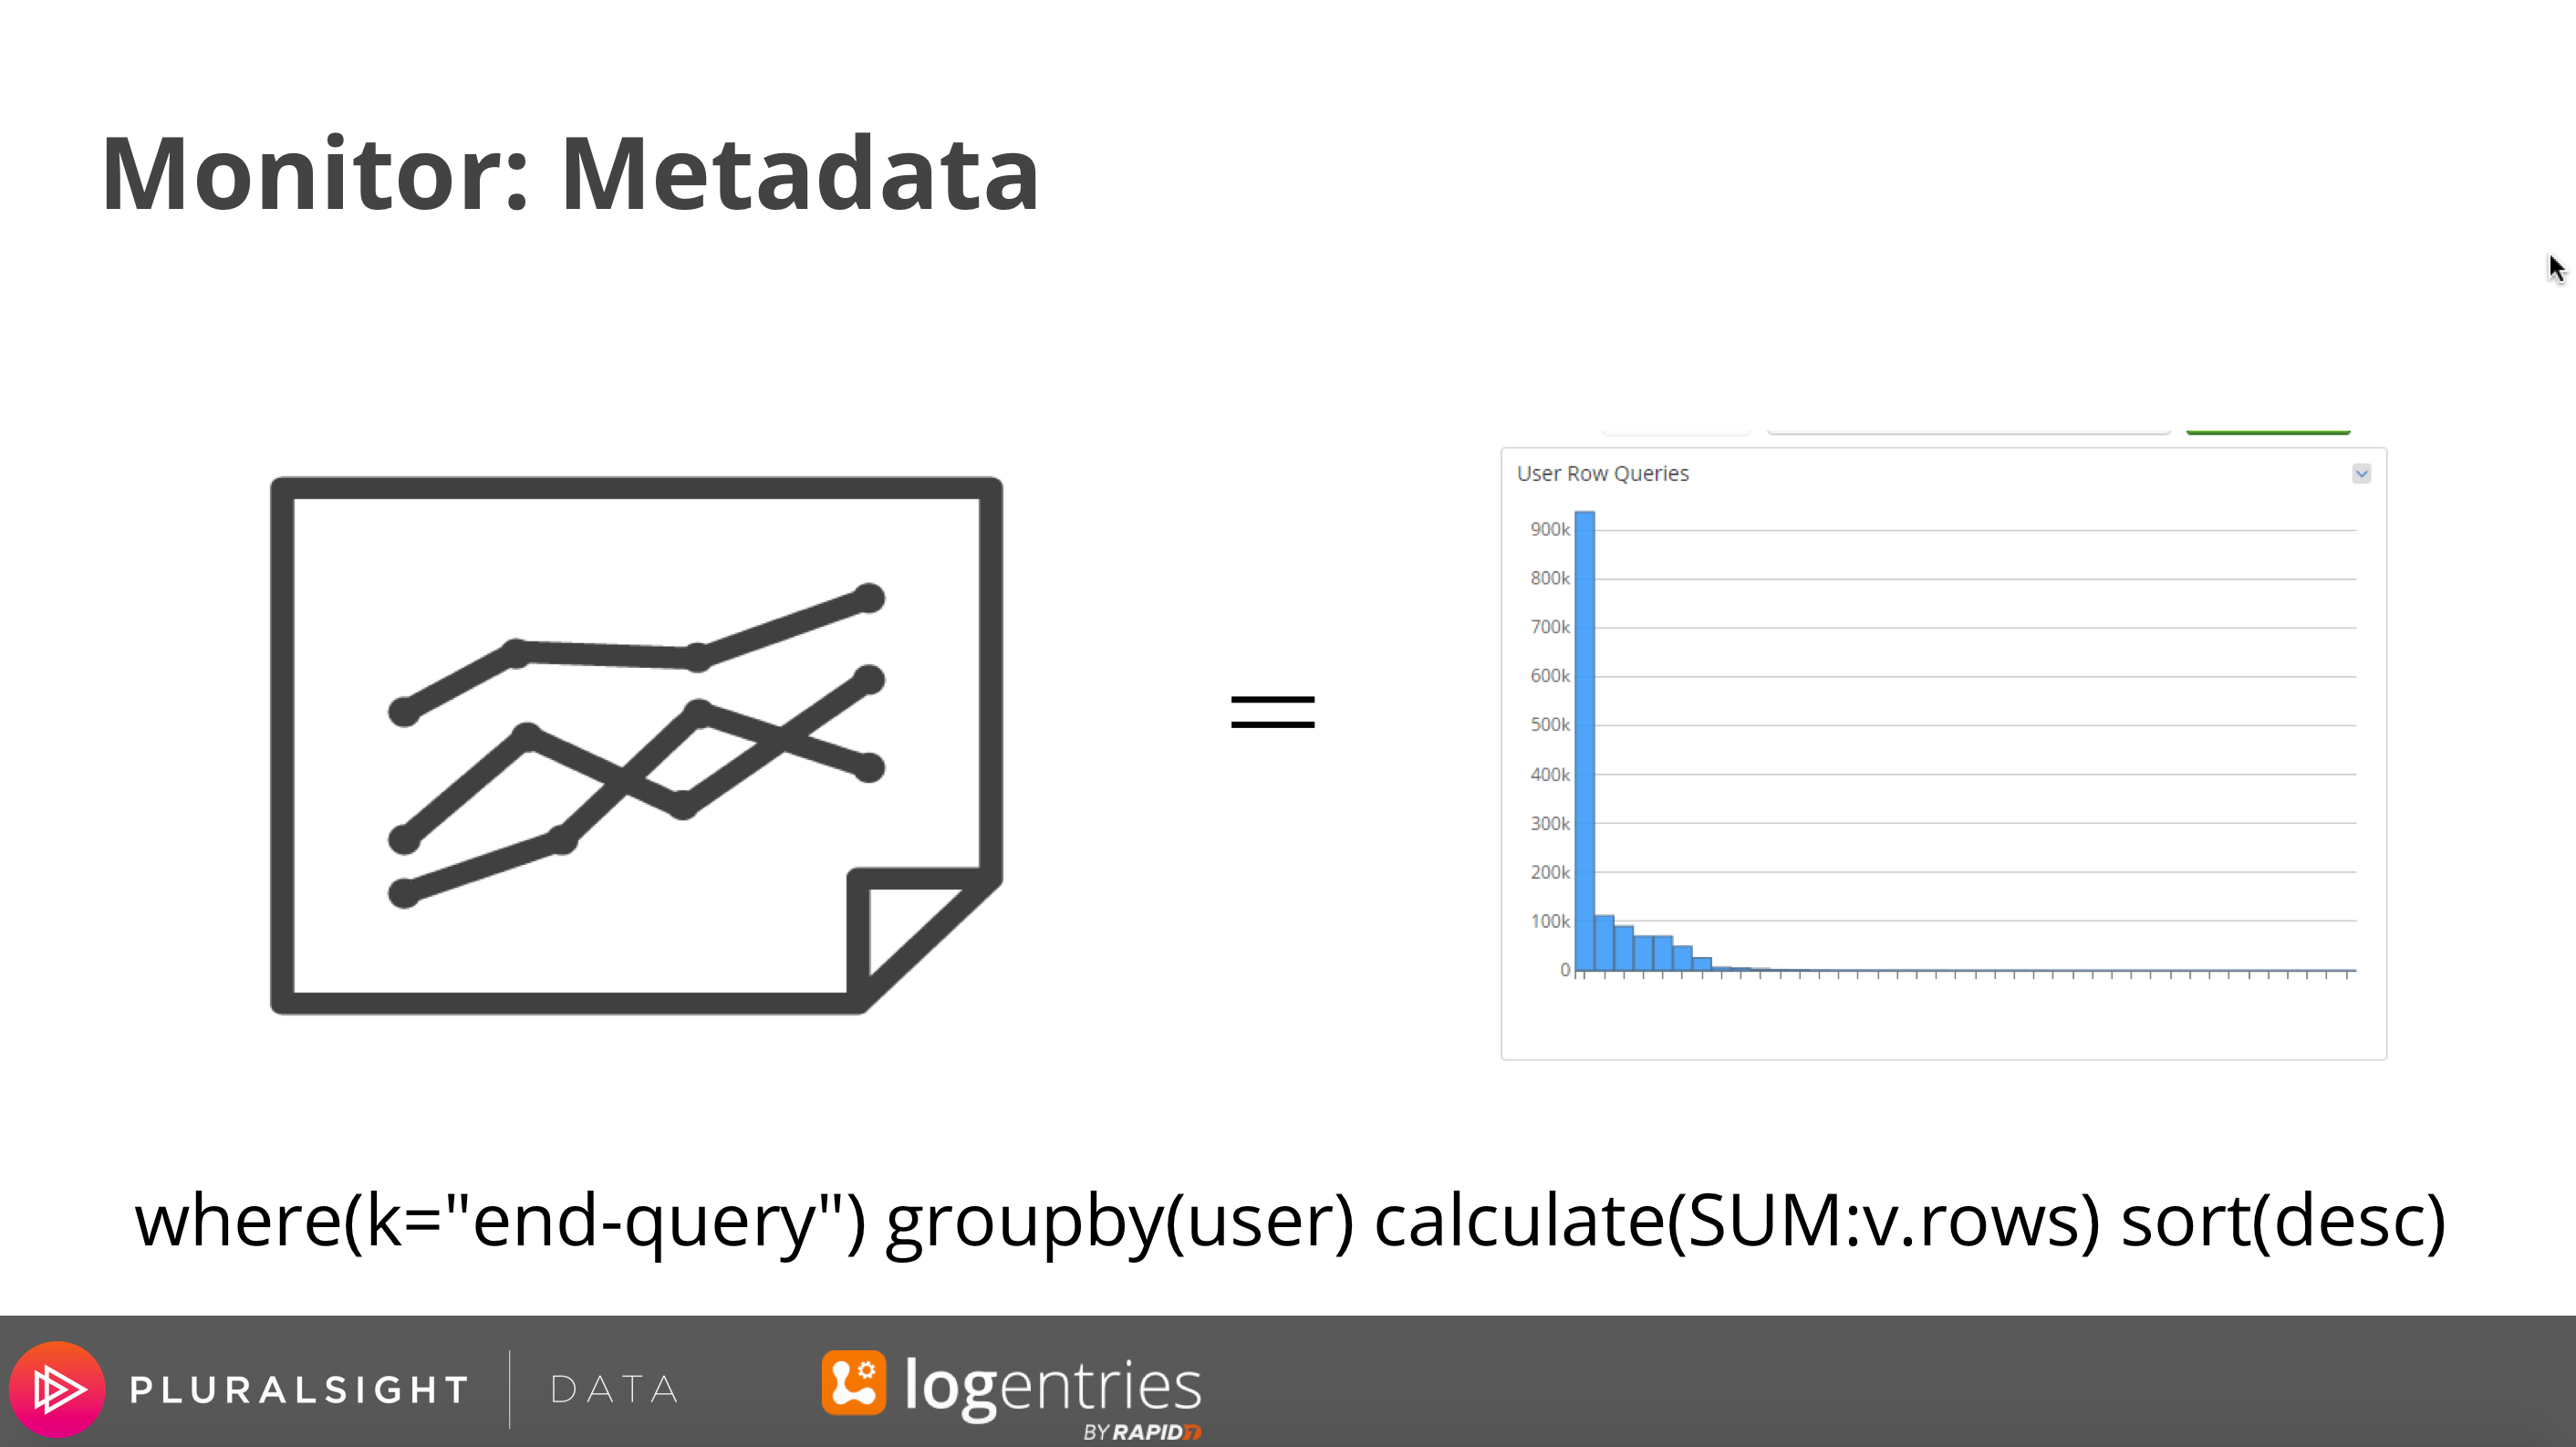
Tableau Community Pack for Logentries
Download and install Logentries’ free Tableau Community Pack. With the help of Mike Roberts at Pluralsight, we’ve built a Community Pack full of queries, tags, alerts and dashboards preconfigured for Tableau. By simply downloading the free pack and uploading it to your Logentries account, you’ll gain immediate access to out-of-the-box insights from your Tableau server.
Click here to download the Logentries Tableau Community Pack.
Read More
To watch the full webinar on-demand, click here.