Last updated at Fri, 03 Nov 2017 20:45:12 GMT
Once upon a time one of the first pieces of software you installed on your infrastructure was a server monitoring tool. This was the control panel through which you could view how effectively your infrastructure was being used, akin to the speedometer and temperature gauges on your car, or the dashboard of dials in an airplane’s cockpit.
Server monitoring tools usually work by capturing resource usage information from your OS performance API or performance counters (e.g. via proc stats on linux) such as CPU, Disk, Memory, Network at a system and per process level. This gives you visibility into which resources are being consumed across your infrastructure, by which applications and services. Seems pretty important to me…So how could Server Monitoring be dead? To me the concept of Server monitoring and the value in collecting this data is still as useful today as it has ever been. However the tools people use to collect this information are changing significantly and, in fact, the solutions solely focused on server monitoring in isolation are a dying breed! 
In the past a server monitoring tool was a standalone application or service (e.g. Server monitoring as a Service) that was focused exclusively on collecting server resource usage metrics, and visualizing these data points in isolation to allow you to understand how your infrastructure was being utilized. Some examples in recent times include the likes of Cloudkick (acquired by Rackspace in 2010) or more recently StackDriver (acquired by Google earlier this year). Don’t get me wrong, there are still plenty of tools out there that primarily focus on server monitoring (and which we mentioned in our recent guide to devops tools) such as serverdensity, scoutapp, or even that old dinosaur NAGIOS which is still (surprisingly) fairly widely used.
However, today monitoring your system infrastructure resources in isolation is not particularly useful. Instead a more valuable approach is to look at server metrics in the context of your application performance metrics, usage trends, and application load. This allows you to better understand how your applications are being experienced by your end users and whether a spike in CPU is having an adverse effect on the response time of your ‘complete payment’ page for example (a page we all know we dont want customers waiting for to load).
This also makes a lot of sense in the context of today’s devops culture where silos are being removed and we want the entire team more focused on how different parts of your environment are ultimately effecting your user experience – as opposed to a pure Ops team that is only concerned with how much capacity is available on your server.
As a result, a more modern approach is to have server monitoring rolled up into other services where it can be correlated with application performance metrics, system level log data, app usage trends as well as data on application load. Examples of this include most APM tools which now include server monitoring as part of their offering. Examples include Logentries, New Relic and App Dynamics which all include server monitoring as part of their performance management offerings. Similarly cloud providers will offer some basic monitoring out of the box for their infrastructure and this is likely why Rackspace and Google made the respective acquisitions mentioned above. Another example is Cloudwatch on AWS, which includes both server monitoring, stats on any AWS service as well as log data. Many cloud providers are looking to roll up service monitoring data with service performance stats along with a logging interface to provide a single view across any service you run within their infrastructure so that users can easily correlate from multiple data points.
For me, the value in server monitoring data is when you can easily correlate it with app performance metrics and log data (which in turn can capture usage, load and further metrics from across your infrastructure) such that you can easily get the full picture and figure out how server resources are effecting your end to end user experience. Correlation is king!
In light of this, we added the ability to turn on server monitoring from our log collection agent. You can now collect server monitoring information (from windows or linux servers) and correlate that with application performance data, system logs, activity logs etc. to more easily troubleshoot and diagnose issues and all from within your Logentries dashboard. This also gives you a more complete picture from an operations perspective whereby you can easily keep an eye on system capacity alongside your app performance.
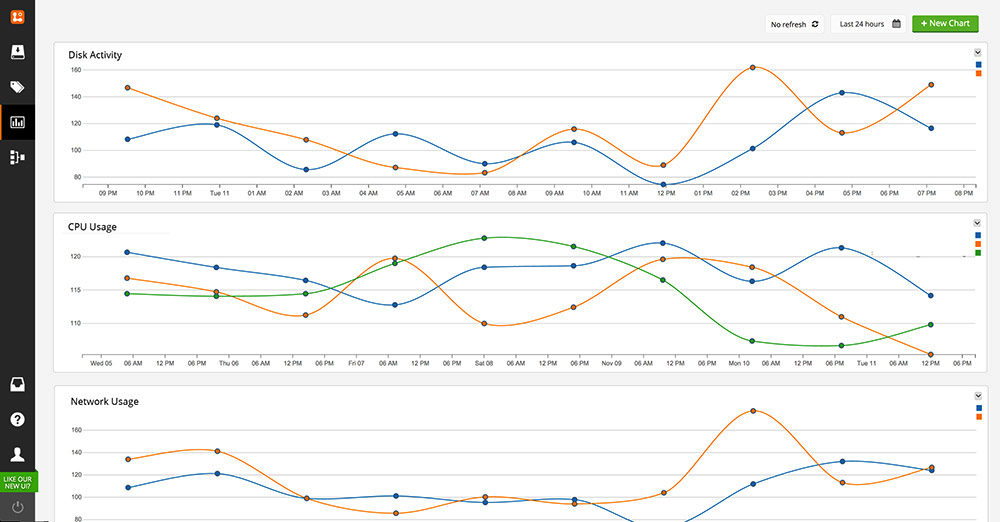
Logentries Server Monitoring Pack Dashboard
If you’d rather not have to manually set up dashboards, queries or alerts for the server monitoring data collected by the Logentries agent you can check out our new free server monitoring community pack which provides all of these out of the box so you can get quick visibility into this data without any need for configuration. Check it out and let us know what you think … If you think you can do better feel free to create your own and make it available to the Logentries community!