Last updated at Tue, 07 Nov 2017 15:38:15 GMT
Background

This blog will give an overview of Software Defined Networks (SDN), present some suggestions for logging in an SDN and finally present an overview of some research work we are doing on SDN logging.
If we consider a Software Defined Network (SDN) paradigm is a racetrack, SDN controllers are race cars. Networking vendors especially those in the telecommunication area such as Deutsche Telecom, Orange, Vodafone use their own SDN controllers to manage the orchestration of their own equipment and in the future the equipment of other vendors. The prize at the finish line is the potential reduction of OPEX, more agile networks and better Quality of Service (QoS). It can sometimes take months to propagate a change in a large network, where with well-orchestrated SDN it could be a matter of hours. The SDN controllers of large networking companies are being supplemented by open source controllers that are designed to support all vendors. The very first SDN controller was NOX, developed by Nicira Networks in 2008. The OpenFlow protocol was also released alongside NOX that year, which triggered a lot of other SDN projects such as POX, Beacon – later Floodlight and OpenDaylight. This blog will show how to log from these controllers to Logentries.
SDN controller
The SDN controller is the “brain” of the network. It is possible and very common these days to deploy multiple controllers in the network, each responsible for different tasks. In fact, to make it more complicated, some network operators decide to deploy multiple controllers, managed by a single master controller, giving us the challenge of running and managing many “brains” in our network. Before we even tackle the orchestration and management issues, we need to discover if there are any issues in our network caused by either controller performance bottlenecks or networking equipment failure.
Logging from SDN Controllers
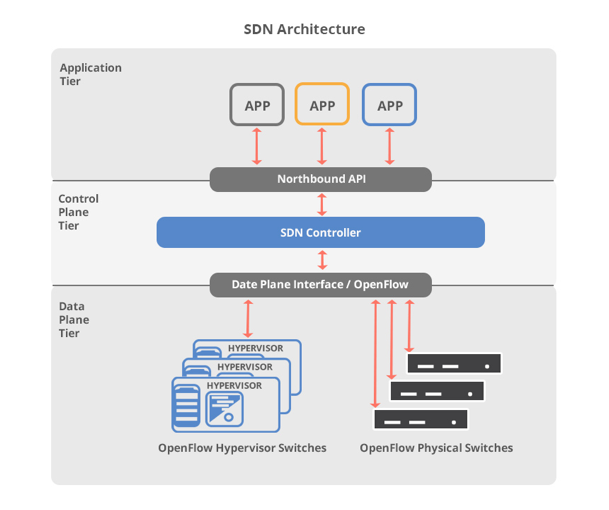
There are at least three layers of the SDN architecture – application tier, control plane, and data plane. In the application layer, we can have any northbound software sitting on top of the network. The control plane is composed of an SDN controller or a set of controllers. It is possible to understand the controller behaviour and performance by looking at the logs produced by it. The SDN controller will contain most of the important information about the state of the network that can be used later in troubleshooting or debugging. Logentries agents or libraries can be used to forward data from soft switches such as Open vSwitch (OvS) and other controllers as follows.
OpenDaylight, ONOS and Floodlight
OpenDaylight, ONOS and Floodlight controllers are all Java based. Logging subsystems embedded in those applications provide facilities for capturing, recording and reporting events that occur within the controllers. This functionality can be enhanced by hooking up the Logentries real-time logging solution. It can be done by using our Java Log4j plugin. The instructions on how to set up the Log4j plugin are published in our docs.
POX and Ryu
Both POX and Ryu are SDN controllers widely used by the research community. They are fully written in Python and use Python’s logging system. Both of those controllers are equipped with log modules that allow us to configure most of the logging options through a command line. We found those logs hard to read, however, even after installing a simple module for POX called *pretty_log, *which converts standard logs to a custom format.
We think a better solution for logging from POX and Ryu controllers is to use the LE agent or LE python library. The difference between the LE agent and LE python library is that the agent forwards data stored in a file, which means that we would have to output all logs from our controller to a file or a set of files as we run the application. This option is not optimal, but may work very well if you have already configured your application to send log data to a file and you don’t want to play with the code any more. On the other hand, the LE python library allows you to log directly from the application easily – Instructions on how to send your logs from a Python application can be found in our docs.
Trema
Trema is a full-stack framework for developing OpenFlow controllers in Ruby and C. The Trema OpenFlow controller is a bunch of Ruby scripts that let the developer add custom message handlers to the controller class just like it is done in Rails. As described above, we can decide to send our log data to the file and then use the LE agent to forward logs to the Logentries account or log directly from the application. Luckily, we can use Ruby gem by Logentries to do just that from the Ruby application as described at https://docs.logentries.com/docs/ruby. It is important to mention that you can keep logging locally in addition to sending logs to Logentries by adding a local parameter after the key. In addition to this, we can instruct the Trema to use SSL when streaming logs to Logentries.
Ovs Example
OvS is a production quality virtual switch, licensed under the open source Apache 2.0 license. It is designed to enable large scale network automation, while supporting standard management interfaces and protocols. By default, the OvS sends log data to two files in the server’s /var/log/openvswitch folder, as below. :
- ovs-openvswitchd.log – switchd is a daemon that manages and controls any number of Open vSwitch devices on the local machine. This log holds information about the datapaths set up, configuration updates, switch to controller connection status and per port information. Link failures are also logged to openvswitchd.log as part of Open vSwitch link monitoring.
Sample output:
2016-12-16T11:05:01.199Z|00077|rconn|INFO|s2<->tcp:127.0.0.1:8888: connecting...
2016-12-16T11:05:01.199Z|00078|rconn|WARN|s2<->tcp:127.0.0.1:8888: connection failed (Connection refused)
2016-07-13T18:14:36.366Z|00064|bridge|INFO|bridge s1: added interface s1-eth2 on port 2
2016-07-13T18:14:36.366Z|00065|bridge|INFO|bridge s1: added interface s1-eth1 on port 1
2016-07-13T18:14:36.366Z|00066|bridge|INFO|bridge s1: added interface s1-eth3 on port 3
2016-07-13T18:14:36.373Z|00067|bridge|INFO|bridge s1: added interface s1 on port 65534
- ovsdb-server.log – this log file is created and updated by the Open vSwitch database server. The ovsdb-server is a lightweight database server that ovs-switchd queries to obtain its configuration. Currently there are 13 tables in the ovsdb database from which we can learn about bridge, port, controller, QoS and SSL configuration. In addition to this, we can obtain basic statistics such as memory usage soon after start-up and periodically as its memory consumption grows.
Sample output:
2016-08-24T11:52:50.538Z|00006|vlog|INFO|opened log file /var/log/openvswitch/ovsdb-server.log
2016-09-06T15:54:34.837Z|00001|vlog|INFO|opened log file /var/log/openvswitch/ovsdb-server.log
2016-09-06T15:54:34.881Z|00002|ovsdb_server|INFO|ovsdb-server (Open vSwitch) 2.5.0
2016-09-06T15:54:47.931Z|00003|memory|INFO|3248 kB peak resident set size after 10.1 seconds
2016-09-06T15:54:47.931Z|00004|memory|INFO|cells:2088 monitors:1 sessions:1
2016-12-16T11:05:00.293Z|00001|vlog|INFO|opened log file /var/log/openvswitch/ovsdb-server.log
2016-12-16T11:05:00.309Z|00002|ovsdb_server|INFO|ovsdb-server (Open vSwitch) 2.5.0
2016-12-16T11:05:11.790Z|00003|memory|INFO|3240 kB peak resident set size after 10.0 seconds
2016-12-16T11:05:11.790Z|00004|memory|INFO|cells:2088 monitors:1 sessions:1
Logentries SDN research
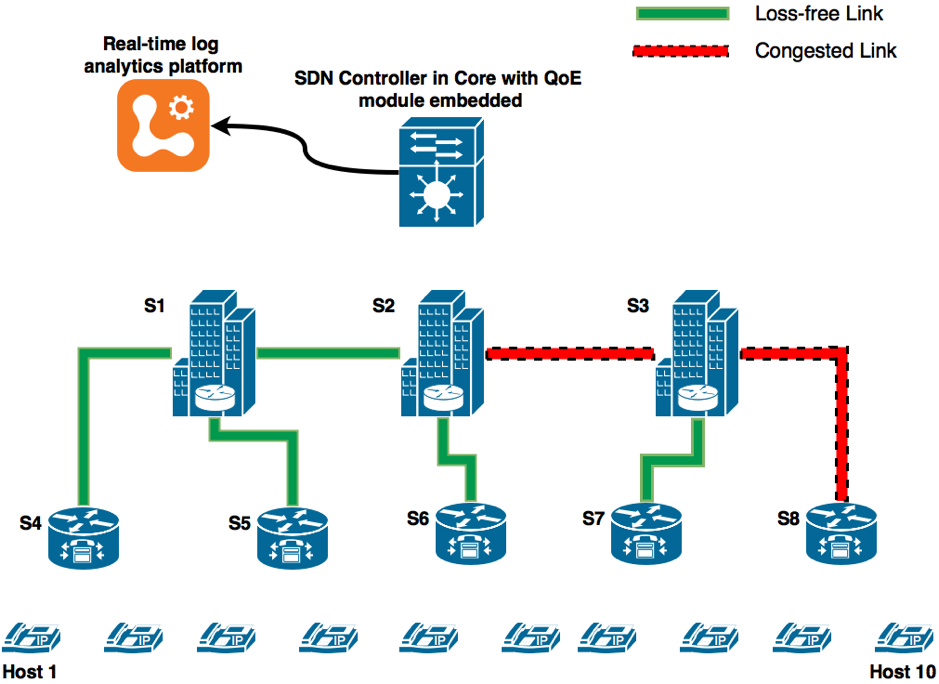
The recent research paper “OpenFlow based VoIP QoE monitoring in Enterprise SDN” proposes a VoIP monitoring system that delivers out-of-the-box methods to identify quality degradation on each link in enterprise VoIP environments. This solution was integrated with the Logentries real-time log analysis engine in order to create custom tags for spotting important events, as shown in the diagram below. Using Logentries as the log analysis platform provided real-time alerts and notifications, but it also acted as a secured cloud database that stores historical data.
The network administrator can catch unusual activity with live anomaly detection based on automated analysis of its Enterprise VoIP system baselines. Those baselines can be created in the Logentries dashboard to trigger multiple alerts later. Those alerts can be published to popular tools like webhooks, email or mobile app, which allows the network administrator to be notified of changes such as low MOS for one or many calls, while being off-line.
Summary
Like most software systems, the SDN controller is typically equipped with logging features that can be used at run time to provide insight into the behaviour of the software and the hardware that it is running on. The amount of logging depends on developer style, but typically it will log the occurrence of major SDN functions such as flow table modification, network component connection status and topology characteristics. The SDN controller log files contain valuable raw information about the network events processed by the software modules.
Ideally, the collected data should be processed in real-time and in a non-invasive style, having negligible impact on the overall system performance. One of the solutions is to use the log analysis tools residing in the cloud to analyse logs from SDN controllers and switches. Applying Logentries as a cloud-based real-time logging tool to SDN is a novel use of a platform, as it requires extensive knowledge of logging, log analysis, network behaviour and SDN domain-specific knowledge.
The biggest advantage of real-time logging platforms is that the log data is analysed and processed as it is streamed to the cloud server. Unlike traditional approaches, real-time logging systems provide insight within seconds and enable immediate notifications, alerts and visualisation of events. This approach means that the network administrator does not need to develop a bespoke analytics platform to observe the impact of traffic variation that can be particularly troublesome in the wireless segments of the network.